
Checking Into Hotel Operators' Economic Moats
We think Marriott and Hilton are the best positioned.
/s3.amazonaws.com/arc-authors/morningstar/2535f698-1e23-4470-9858-dc4e82afe213.jpg)
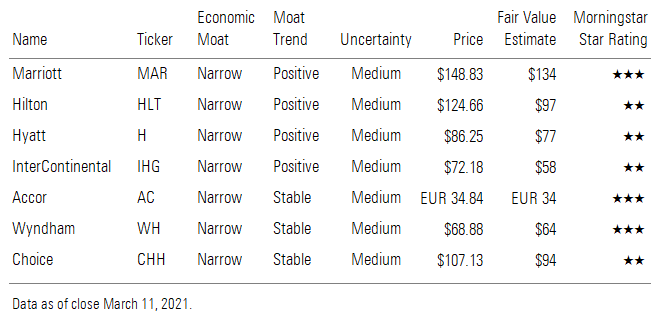
We see brand intangible asset and switching cost advantages as the main drivers of economic moats for hotel operators. We believe Marriott MAR, Hilton HLT, Hyatt H, InterContinental IHG, Accor AC, Wyndham WH, and Choice Hotels CHH have amassed these competitive barriers and are able to properly monetize them, driving their narrow economic moats.
Hotel brand intangible asset advantages take time and money to develop. A hotel operator in its infancy needs to self-fund development to support unit growth of its brand and prove that the concepts can perform before third-party owners gain enough confidence to commit their own capital and join the company’s portfolio as franchisees. This asset-heavy portfolio in the early days of a hotel operator’s growth cycle typically leads to lower margins and returns than those of an asset-light model of third-party franchisees and managed hotels.
There is not a magical unit figure that an operator must reach before this tipping point from self-funding to third-party development naturally occurs, but Hyatt offers an example. In 2017, Hyatt began to comment that its proportion of third-party development funding was rising, as confidence increased in the performance of its brand. Around this time, Hyatt’s room portfolio was reaching a notable size (176,969 rooms in 2016), although it was still just 15% and 23% of industry-leading offerings from Marriott and Hilton, respectively. Still, this inflection point helped drive Hyatt’s return on invested capital, including goodwill, to average 6.8% in 2015-19 versus 2.3% in 2010-14. It was this inflection point in 2017 that convinced us to upgrade our economic moat rating for Hyatt.
As a hotel operator’s asset mix shifts toward franchisee and managed contracts, thereby driving an intangible brand advantage, it naturally drives a switching cost benefit, a second economic moat source. These franchisee and managed relationships typically have contract durations of 20-30 years. Termination and switching of these contracts to another operator requires significant expenditures to renovate and rebrand a property to meet the new brand specifications, which results in a disruption to business operations for the owner and leads to termination fees that must be paid by the owner (typically around two to three years’ worth of average monthly management fees plus the previous year’s incentive fee). As a result of sustainable brand intangibles and meaningful switching costs, voluntary attrition of the managed and franchised customer base for competitively advantage operators is typically in the low single digits.
We see four key factors influencing the outlook for intangible brand and switching cost moats for the hotel operators we cover.
- What is the long-term structural impact from the global pandemic?
- How do the size and engagement of loyalty programs alter competitive positioning?
- How does unit scale sway economic moats?
- What is the competitive impact from alternative accommodations?
COVID-19 Doesn’t Pose a Long-Term Threat to Hotel Operators
Overall, we don't expect COVID-19 to meaningfully alter hotel operators' narrow economic moats, as we expect a full rebound in travel demand over time. We've already seen evidence that the pandemic did not damage the appetite for hotel visits, and we think this stands to persist, as the potential for increased leisure travel could remain if remote working doesn't entirely abate. That said, the accelerated use of video conferencing during the pandemic could lead to lower long-term levels of corporate travel; this could cause slight headwinds for Marriott, Hilton, InterContinental, and Hyatt, which have historically garnered a higher mix of business travelers than Wyndham and Choice.
Our long-term outlook assumes a full recovery in hotel revenue per available room, or revPAR, by 2023, mimicking past demand shocks like 9/11 and the great financial crisis. Our analysis finds that U.S. hotel industry revPAR returned to 2000 levels by around 2004, after the 9/11 and 2001 recession events, while it also took around four years for revPAR to recover to 2007-08's level of demand after the financial crisis.
Our expectation for a recovery in revPAR by 2023 harmonizes with Morningstar's long-term prognosis for a full economic rebound and minimal long-term impact on the economy. Demand shocks tend to have long-run impacts to the economy only when persistent economic policy error occurs, which we don't believe to be the case in this current environment, given quick and strong monetary and fiscal stimulus.
We also don't see COVID-19 meaningfully changing the outlook for hotel operators' moats, given the strong rebound already experienced in the industry during the pandemic. During COVID-19, travel options were largely reduced to local road trips at either alternative accommodation rentals or traditional hotels. Demand for hotels in nonurban and drive-to locations saw strong use, considering the environment. Lower-priced economy hotels skew heavily to nonurban and off-interstate drive-to locations, which were in a position, along with alternative accommodations, to see relative demand outperformance as the pandemic took hold. Conversely, higher-priced luxury hotels tend to have a heavier mix in urban areas with demand resulting from air travel. As a result, U.S. economy hotels greatly outperformed luxury, with the former improving to a single-digit year-over-year revPAR decline at the start of 2021 versus the 50% drop at the nadir in mid-April 2020. This compares favorably with luxury resorts that were still showing around a 60%-70% decline at the start of 2021 versus the 95% fall seen in mid-April.
While we believe COVID-19 will not meaningfully impede long-term hotel demand, we do expect some continued business use of video conferencing, which many companies have found to be an adequate means of business communication. This could cause cannibalization of business trips even when COVID-19 is contained. We see Marriott, Hilton, Hyatt, InterContinental, and Accor more at risk here, given their historical 60%-70% business from corporations versus around 30% for Choice and Wyndham.
However, we think this will not prove a deterrent for three reasons.
- We think that some sustainment in the recent bump in remote working caused by COVID-19 will prompt incremental leisure or business/pleasure trips, benefiting hotel operators that can offer a comfortable work environment in a pleasant location. In fact, the trend toward business/pleasure travel was already occurring before COVID-19. Expedia surveys show the percentage of business trips with a leisure component has grown rapidly, moving to 60% in 2018 from around 43% in 2016.
- It is our understanding that the corporate mix for many hotel brands had been trending down even before the pandemic, which offers evidence that hotel operators are able to adapt to changing demand environments. Hotel operators were already offering rooms and business center space by the hour or portion of the day to entice at-home workers who need a change of scenery. Also, hoteliers plan to market their units as a place for teams working in various remote locations to gather for business purposes as well as pleasure use of on-site bars, restaurants, and spas, which we see as prudent.
- It is possible that video conferencing will not cannibalize business travel to any material extent, based on the view that in-person communication builds trust and relationships essential to winning and maintaining clients. Many travel executives have said that corporate travel hasn't been hindered by past demand shocks, and they don't anticipate this time will be any different.
Our steady-state 2026-29 revPAR forecast does account for lower corporate travel growth relative to leisure. We estimate hotel industry corporate travel to average around 2% growth during 2026-29, well below the roughly 5% forecast for leisure trips. Further, we believe that Marriott, Hilton, InterContinental, Hyatt, and Accor will be able to adapt and continue to drive a higher mix of leisure and business/pleasure toward 50% by 2025 from around 35% in 2019. Finally, our views incorporate our outlook for demand and supply across the various price points of the hotel industry. As a result, we estimate Hyatt, Marriott, Hilton, InterContinental, and Accor to average 2026-29 revPAR growth of 2%-3% annually, still above our U.S. industry expectation of roughly 2%, despite a higher corporate mix and industry supply at the upscale and luxury segments. This compares with the 3%-4% at Wyndham and Choice, whose economy and midscale presence sees higher leisure exposure and lower relative industry supply growth.
Loyalty Programs Aid Hotel Operators’ Competitive Standing
We also believe it’s important to analyze industry loyalty exposure to help gauge moats. We see Hilton and Marriott as offering clear loyalty leadership, followed by InterContinental and Wyndham, with Accor, Hyatt, and Choice slightly less advantaged.
The reason loyalty programs influence hotel intangible asset and switching cost advantages is that third-party owners look at the immediate demand channel these provide when considering joining one of the chains. In our view, Marriott’s and Hilton’s loyalty presence offers a strong incentive to third-party hotel owners to join their brands.
- Marriott leads the industry on the loyalty front, with 141 million loyalty members at the end of 2019, who drove a solid 52% of its room nights that year.
- InterContinental had around 125 million members at the end of 2019, per our estimates, ranking second behind Marriott. We mark its moat benefit from this loyalty program below those of Hilton and Marriott due to its relatively lower engagement, with an estimated 45% of its 2019 room nights coming from these travelers.
- Hilton had 103 million loyalty members at the end of 2019. Though that puts it at third in the market behind Marriott and InterContinental, its program saw industry-leading engagement, with 64% of its room nights derived by these individuals in 2019.
We also highlight Wyndham’s loyalty program as having a positive influence on competitive positioning, driven by 81 million members in 2019 that filled 44% of its rooms. Further, we believe Wyndham operates quality hotels, with the top guest satisfaction economy brand (Microtel) in 16 of the last 18 years and midscale brand (Wingate) in 5 of the past 6 years, according to J.D. Power. Finally, we believe Accor’s 64 million loyalty members as of 2019 (estimated to fill around 35% of its rooms), Choice’s 44 million loyalty members (45%), and Hyatt’s 30 million loyalty members (41%) drive some benefit to their intangible brand and switching cost moats.
Unit Scale Enhances Hotel Operators’ Competitive Edge
The size of the hotel portfolio provides motivation for unit growth, thereby influencing economic moats in the industry. Here, we see Marriott’s leading scale as a material positive in supporting its economic moat, followed by Hilton, InterContinental, and Accor, while Wyndham, Hyatt, and Choice see a more muted benefit.
Hotelier unit scale matters for economic moats for a few key reasons.
- Scale can provide third-party hotel owners lower procurement or distribution costs than an independent hotelier. During its May 2020 earning call, Wyndham mentioned that independent hotel owners might be getting 50%-100% of their business through online travel agencies, which have commission rates as high as 25%. It suggested that because of its scale, it may be possible to get this down to around one third from online travel agencies and at lower costs.
- Unit scale can also lower conversion costs for existing independent hotels, as it increases the likelihood of finding a brand concept that closely matches the third-party's motif, thereby reducing time and cost to launch the new label.
- Having many units can aid loyalty program growth and help drive further unit demand for third-party owners.
Marriott is the clear unit scale leader in the industry, with nearly 1.4 million rooms at the end of 2019 and about 2,000 hotels professionally managed (offering services like hiring, training, and housekeeping, which aid managed unit growth in addition to franchisee unit growth). The unit scale of Hilton, InterContinental, and Accor also positively influences their brand intangible and switching cost advantages, supported by their roughly 1 million, 900,000, and 740,000 rooms, respectively, at the end of last year, with a healthy 700, 1,000, and 2,310 professionally managed hotels. We also see some moat benefit from unit scale for Wyndham (831,000 rooms and 392 managed hotels at the end of 2019), Choice (590,108 rooms), and Hyatt (226,674 rooms).
Alternative Accommodations Not a Material Risk to Hotels’ Economic Moats
A final key factor to consider when evaluating hotel operators' economic moats is the competitive threat from alternative accommodations, which we expect to continue to be manageable for all hoteliers that we cover.
Global online hotel bookings have remained resilient in the face of strong alternative accommodation growth. During the past decade, online bookings for traditional hotels were able to maintain around a low-double-digit annual increase, which is despite online alternative accommodation booking growth of around 20% most years during this time. We believe this buoys our view that alternative accommodations have expanded the travel market more than they have cannibalized the traditional hotel business.
We also see evidence that demand for hotels was just as strong, if not stronger, than for alternative accommodations during the worst of the COVID-19 pandemic. Travel options during COVID-19 have been largely limited to local road trips and either economy hotels or alternative accommodations. Within this framework, U.S. economy hotels posted a strong rebound and relative performance to alternative accommodations, improving to a 12% year-over-year revPAR decline in September 2020 versus the 43% drop seen at the nadir in April. This compares with the 23% booking drop that Airbnb ABNB saw in September 2020 versus the 72% decline it posted in April. We believe this shows that interest in hotel travel is intact and that alternative accommodations are not suddenly set to meaningfully cannibalize the industry’s demand.
Marriot, Hilton, Hyatt, InterContinental, Accor, Wyndham, and Choice
/cloudfront-us-east-1.images.arcpublishing.com/morningstar/LE5DFBLC5VACTMC7JWTRIYVU5M.jpg)
/cloudfront-us-east-1.images.arcpublishing.com/morningstar/PJQ2TFVCOFACVODYK7FJ2Q3J2U.png)
/cloudfront-us-east-1.images.arcpublishing.com/morningstar/KPHQX3TJC5FC7OEC653JZXLIVY.jpg)
:quality(80)/s3.amazonaws.com/arc-authors/morningstar/2535f698-1e23-4470-9858-dc4e82afe213.jpg)