
ETF Inflows Propping Up Gold Prices
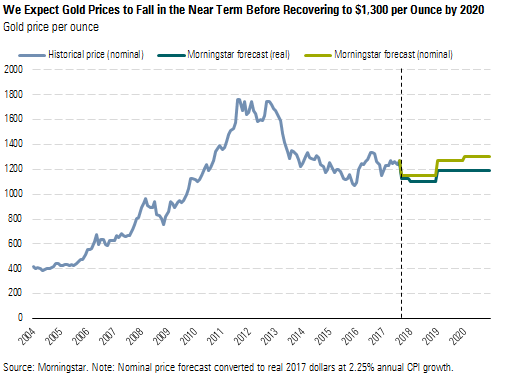
With fundamentals outside of investor demand looking weak, we expect gold prices to fall through 2018.
/s3.amazonaws.com/arc-authors/morningstar/220f0649-85f9-4004-a281-b91d9bc53139.jpg)
Breaking a long trend, demand for gold jewelry in China and India has plummeted in recent years, dragging global demand to its lowest level in seven years. But despite this massive decline in the largest single source of gold demand, prices have proved resilient, largely due to strong investor demand. In the face of ongoing interest rate hikes by the U.S. Federal Reserve, exchange-traded fund holdings have risen to levels last seen in 2013, a period defined by much higher gold prices.
Prevailing prices of nearly $1,300 per ounce have limited fundamental support. Continued rate hikes threaten to reverse last year’s near-record ETF inflows, as still-manageable inflation would push real interest rates well above levels that attract investor interest. We expect gold prices to fall in the remainder of 2017 and into 2018 before increased Chinese and Indian jewelry demand catalyzes a rebound. Investor outflows can strike suddenly, but a full recovery in jewelry sales will take time.
Trends in Gold Supply and Demand Gold markets have surprised many analysts over the past couple of years, including us. The sources of demand strength and weakness have upended many forecasts--investor demand proved resilient in the face of gradually rising interest rates, and once-surging emerging-market jewelry demand crested and fell.
ETFs stocked up on gold in a big way in 2016. It was the second-largest accumulation of gold by ETFs in a calendar year, lagging only 2009, which was surprising, since rising real interest rates have historically been associated with ETF outflows.
Yet we doubt the relationship between real rates and investor gold demand is irreparably broken. Rising real interest rates will increase the opportunity cost of owning gold, which should eventually trigger ETF outflows and pressure gold prices. We continue to view ETF outflows as the biggest near-term threat to gold prices. For example, in 2013, as investors liquidated nearly 25% of their holdings in gold ETFs, gold prices fell by roughly $300 per ounce, or about 25%. Gold miner stocks followed suit, with most names plunging 50%-70%.
While investor demand has strengthened over the past two years, jewelry purchases have slowed significantly. In 2016, global gold jewelry purchases totaled just 1,891 metric tons, down more than 23% from 2014. Despite weakness in the two largest gold jewelry markets (China and India), we think underlying fundamentals remain strong. As governments pull back on policies that hamstrung gold buying and as household incomes continue to rise, we expect China and India to drive long-term growth in gold jewelry demand.
Investment demand and jewelry have had the largest impact on the current balance of gold supply and demand. We expect recent trends--rising investor demand and falling jewelry demand--to reverse in the years to come.
The timing of these two reversals portends near-term pressure on gold prices. We expect investor demand to weaken amid continued rate hikes, which should result in a significant outflow of gold ounces from ETFs. Not only does lower investor demand result in weaker demand for gold, it also results in excess supply, as these ounces are sold back into the market. As a result, we forecast gold prices will be weak in the near term, declining to $1,150 per ounce by the end of 2017.
In the longer term, provided real rates remain above zero, investor demand is unlikely to return in a big way. However, the foundation for growing jewelry demand is still there. We expect growing demand from China and India will drive stronger overall gold demand in the future.
We Expect Gold Prices to Fall in the Near Term Before Recovering to $1,00 per Ounce by 2020
In recent years, mine production has continued to grow. Amid efficiency drives, lower oil prices, and weaker producer currencies, mine costs have fallen over the past three years, allowing higher-cost mines to remain in production. Falling production costs have helped support production growth, despite weaker gold prices. However, through the first half of 2017, oil and currency trends appear to be reversing and may push production costs higher, constraining supply and lifting prices.
The precipitous decline in oil prices continued into 2016, with Brent crude oil prices down roughly 45% from 2014 levels. However, oil has since recovered somewhat, with the latest spot prices for Brent up 11% from the 2016 average. Morningstar’s energy team forecasts Brent prices to reach $60 per barrel by 2020, 35% higher than today’s spot price. All else equal, higher oil prices should push gold production costs higher.
Currency movements also helped reduce gold production costs. In 2016, key producer currencies like the Canadian dollar, Australian dollar, yuan, and Russian ruble weakened 3%, 1%, 4%, and 9% against the U.S. dollar, respectively, extending multiyear trends. Weaker local currencies effectively lower U.S. dollar-denominated mining costs. However, this deflationary effect on costs appears to be fading. Through the end of July, the Canadian dollar, Australian dollar, and Russian ruble have actually strengthened 7%, 10%, and 3% against the U.S. dollar, respectively.
Despite recent years of improved free cash flow across gold companies, this hasn’t yet resulted in significant new mine investment. Meanwhile, increased production has depleted the industry’s reserves. Reserves have fallen 13% for the gold miners we cover, leading to a 6% decline in the implied reserve life. Though exploration could increase reserves, investing in new mines will be required to boost supply. We continue to expect undersupply to encourage the development of new projects, and we reiterate our long-term gold price of $1,300 by 2020.
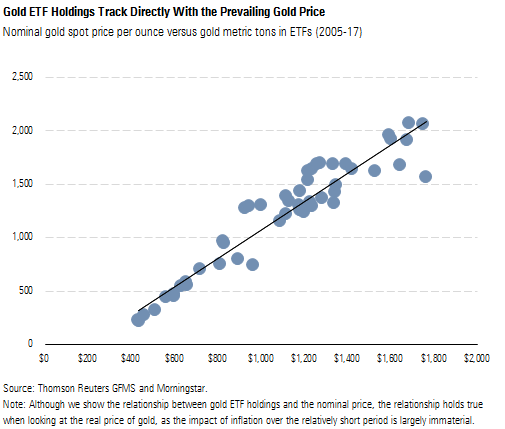
Investment Demand Unlikely to Sustain Current Levels Historically, a positive real interest rate has been negative for gold prices, as it raises the opportunity cost of holding the yellow metal. This can be seen in the historical relationship between real interest rates and the gold price. Only when real interest rates dipped into negative territory in 2011 did gold prices approach nosebleed heights. Not long after, real rates returned to positive territory in 2013, and gold prices fell dramatically. Based on the relationship between real interest rates and gold prices, it's no surprise to see a tight connection between the gold price and the amount of gold invested in ETFs.
Gold ETF Holdings Track Directly With the Prevailing Gold Price
With the federal funds target now at 100-125 basis points, the real cost of holding gold is higher than prior years, when the fed funds rate was near zero. While the real interest rate has flirted with negative territory, it’s remained at about 40-50 basis points since July 2016. Despite what appears to be a weakening investment case, ETF holdings remain just as high as they were before the Federal Reserve set out on its path of rate hikes. ETF holdings stand at levels seen amid the much higher gold prices of early 2013. Those holdings seem likely to be released back into the market if the Fed maintains its course of rate hikes.
ETF Holdings Remain at Levels Not Seen Since 2013
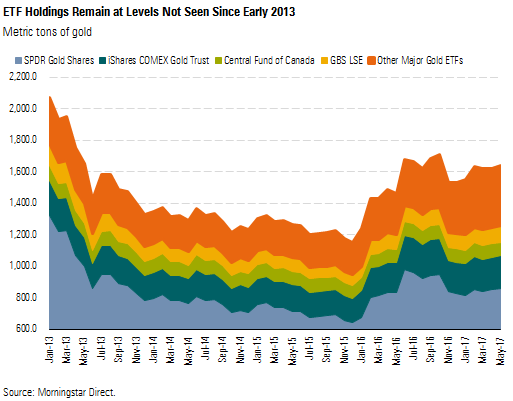
There’s ample precedent for a sudden surge in ETF selling brought about by rising rates. During 2013, ETFs experienced massive outflows of gold (nearly 750 metric tons, or a 36% decline from the start of the year). This was primarily driven by rising yields on 10-year U.S. Treasuries, which increased the opportunity cost of holding gold; 10-year Treasury yields rose more than 100 basis points in just a few months. Yet while the real interest rate remains at the levels that drove outflows in 2013, gold ETF holdings remain elevated. Geopolitical uncertainty continues to be a significant driver--Bridgewater Associates founder Ray Dalio, for example, recommends that investors put 5%-10% of their portfolios in gold because of this.
Geopolitical uncertainty is a material risk that is often quite difficult to measure. Gold can provide some safe-haven potential in volatile periods, particularly since it’s less exposed to any single country compared with alternatives like currencies or government securities. But the appeal of gold as a safe haven depends on a bit of circular logic: It only provides a safe haven if enough investors believe it does.
Given that we can’t predict the timing, severity, or likelihood of major geopolitical events, we do not explicitly use it to shape our forecasts. While geopolitical risks can provide a short-term lift to gold prices, they provide little long-term support. Even the impacts of the biggest events fade with time, while the banality of supply and demand endures.
ETF Gold Demand Is Likely to Fall The Federal Reserve's statutory mandate focuses on two key metrics, maximum employment and stable prices, and we don't see any developments that should stall its plan for continued rate hikes.
The Federal Reserve’s estimate of a long-term natural rate of unemployment is about 4.7%, a target that the central bank is comfortable with and that represents the necessary slack for the labor systems to function appropriately. When unemployment is meaningfully higher than 4.7%, we would expect the Fed to employ more accommodative policies. As of July, the Bureau of Labor Statistics estimates that unemployment in the United States is just 4.3%.
In addition, the latest commentary from the Federal Reserve’s Federal Open Market Committee states that the bank expects labor market conditions will tighten even further. With employment performing better than targeted, inflation remains the bigger concern for the FOMC. In its June statement, the committee noted that inflation had declined and was running somewhat below the long-term target of 2%.
Inflation (as measured by the Bureau of Economic Analysis’ personal consumption expenditures less food and energy price index, with which the Fed compares its target) has averaged roughly 1.5% over the past three years. After strengthening throughout 2016 toward 2%, inflation weakened in the second quarter to 1.5%. We also looked at other measures of inflation. While the Bureau of Labor Statistics’ alternative inflation measure of CPI less food and energy surpassed 2% throughout 2016 and into 2017, it shows a similar concerning downward trend. Inflation has declined about 60 basis points to 1.7% in June.
Inflation Expectations Don't Provide Much Optimism Inflation expectations, which have fallen, are of particular importance, as consumer assumptions about future prices influence purchasing behavior and thus economic activity. When consumers expect inflation, they tend to accelerate purchases to get in front of price increases. Likewise, when they expect deflation, they defer purchases, waiting for better prices. As a result, inflation expectations have a significant and somewhat circular impact on economic activity.
Neither market-based nor survey-based expectations paint an optimistic picture of future inflation. Based on implied rates from U.S. Treasuries, both the 10-year break-even expected inflation rate and 5-year, 5-year expected inflation rate have fallen below 2%. Rates remain above where they were a year ago, but a continued decline would probably delay future rate hikes. Amid the weakness in 2016, the central bank delivered only one increase compared with its original forecast of four.
Though survey-based inflation expectations have remained relatively steady through 2017, they fail to provide much optimism either. The University of Michigan’s latest consumer survey reported inflation expectations of 2.6%. While the survey-based rate is above 2%, the approach has a few shortcomings that require adjustments for comparability. First, relying on self-reported price perceptions leads to observation bias toward price increases and frequent purchases over price decreases and infrequent purchases. Second, the survey-based approach neglects to take into account improvements in quality and changes in preferences. Federal Reserve studies have noted that perception of inflation has differed about 75-100 basis points from actual inflation. When we reduce the latest University of Michigan survey by 100 basis points to account for the survey-based approach, inflation expectations fall to 1.6%, closer to market-based expectations. In light of this, the FOMC expects near-term inflation to remain somewhat below 2% in the near term but reiterated expectations that it will stabilize around the 2% objective over the medium term.
It appears to us that the market believes weak inflation could slow the pace of Fed rate increases. In turn, this would be positive for gold, as it would limit rising opportunity costs of holding gold.
However, this logic strikes us as a bit circular. With unemployment low, inflation is what’s holding back faster rate hikes. Yet weak inflation means real interest rates are unlikely to be negative. While stronger inflation could reduce real rates (helping gold demand), the FOMC would most likely respond with further rate hikes as inflation neared its target (hurting gold demand). In either case, we don’t see a return to very low or negative real rates that would buoy gold prices.
Furthermore, the real interest rate is still positive, meaning there is still an opportunity cost to holding gold. Rates are not materially different from 2013 levels, when interest in gold investment soured.
While ETF inflows have supported gold prices over the past year or so, they have the potential to flood the market with supply when sentiment turns. As the investment case for gold weakens, ETF holdings are likely to decline, dragging gold prices lower, which could, in turn, trigger further selling. For example, ETF holdings and gold prices declined roughly 30% in 2013, when market sentiment on gold’s investment case weakened. We continue to expect that waning investment demand will pressure near-term gold prices, which will decline to $1,150 per ounce by the end of 2017.
Gold a Victim of China's Attempts to Halt Capital Flight In 2016, global jewelry demand fell more than 20% to levels last seen during the financial crisis. Higher prices were partly a cause, as the average U.S. dollar-denominated gold price in 2016 was about 8% higher than in 2015 and higher still in key currencies like the yuan and Indian rupee, both of which fell against the dollar in 2016.
While higher prices clearly weighed on jewelry demand, they were not the primary cause. After all, gold price increases in prior years did not lead to as substantial a decline. For example, when the average gold price rose about 6.5% in 2012, jewelry demand fell only about 1.5%. In addition, when overall prices were $100-$500 per ounce higher from 2011 to 2014, jewelry demand was still higher than it was in 2016.
The fact that nearly all of 2016’s sharp drop in jewelry demand was attributable to China and India suggests country-specific factors were largely to blame. Year over year, official Chinese gold jewelry demand fell 17% and Indian purchases fell 31%.
Some analysts speculate that Chinese jewelry demand’s massive fall was attributable to changing consumer preferences. According to surveys conducted by the World Gold Council, younger Chinese prefer to spend their money on experiences rather than material possessions. However, we doubt preferences could change swiftly enough to cause a nearly 20% year-over-year decline in jewelry demand.
Moreover, a dramatic change in household attitudes toward gold fails to explain why Chinese demand for bars and coins actually increased in 2016--up more than 7% to nearly 237 metric tons for bars and 30% to almost 30 metric tons for coins.
Rather than a shift in consumer preferences, we think the dramatic decline in gold jewelry purchases was driven by Beijing’s efforts to stem capital outflows. We estimate $1.4 trillion in net capital outflows from China from 2014 to 2016. Over the same interval, China’s foreign reserves dropped by $801 billion as the People’s Bank of China sold dollars to meet renminbi redemptions. More concerning from Beijing’s perspective, capital outflows had the effect of diminishing the efficacy of stimulus efforts. As the central bank pumped more money into the system, investors, corporations, and households were taking it abroad.
Beijing responded with measures intended to stem outflows, including tighter restrictions on outbound M&A and trade finance. Gold purchases were also targeted. According to the Financial Times in late 2016, even banks with licenses were having difficulty obtaining approvals to import gold. Those efforts were largely successful, even if they failed to address the underlying causes of capital flight. We estimate capital outflows slowed to $85 billion on an annualized basis in the second quarter of 2017 compared with annualized outflows of $399 billion in the second quarter of 2016. China's foreign reserves have now stabilized around $3.1 trillion.
Gold was a clear casualty of these efforts. From 2015 to 2016, Chinese gold purchases fell nearly 20% to 1,281 metric tons. Supply shortages widened, and the premium between the Chinese gold price and the world gold price spiked, rising to well over $10 for most of the fourth quarter of 2016 and into 2017. A divergence in price for a globally fungible commodity rarely happens when it can flow freely. If the drop in gold jewelry consumption were driven by weaker demand, we wouldn’t expect the premium to rise so dramatically.
Since Beijing has started to relax capital controls, the fall in jewelry demand has slowed. The World Gold Council estimated Chinese gold jewelry demand at 314 metric tons for the first half of 2017, down just 3% from 325 metric tons for the first half 2016, albeit still well below the five-year average of 378 metric tons. As controls are further loosened, we expect demand to enjoy a fuller recovery.
India's Attempts to Address Current Account Deficit Lead to War on Gold 2016 was particularly difficult for Indian jewelry demand for two main reasons. First, the government's continued attempts to stem its current account deficit led to significant uncertainty, particularly around potential changes to the tax system. Second, another poor monsoon season led to a third year of disappointing crop yields, crippling the income of nearly two thirds of India's gold purchasers.
India has long struggled with a current account deficit. In particular, the government is concerned about the detrimental effect it has on the rupee. Despite the fact that a weaker rupee could strengthen the global competitiveness of India’s exports and narrow its trade deficit, Prime Minister Narendra Modi desires a strong national currency, which is a longstanding view of his Bharatiya Janata Party. Modi used the 2013 decline in the rupee to attack the United Progressive Alliance, India’s ruling coalition at the time.
Gold is a big part of the problem. According to the World Bank, official gold imports constituted almost 8% of India’s total imports in 2015, second only to oil. Imports are necessary to meet the country’s huge appetite for gold, which can’t be met by domestic production. But gold is a particularly unproductive import, as it provides little utility outside of potential investment or aesthetic purposes.
India has long sought to limit gold imports by levying import taxes. In recent years, the government has doubled its efforts. Before 2011, the tax was a flat INR 300 per 10 grams, or about $15 per ounce at 2011 exchange rates. In 2012, this was switched to a 2% import tax rate, allowing the total amount collected to rise with higher gold prices. By early 2013, the government increased the rate two more times to 6%.
Delhi rolled out a host of anti-gold policies in mid-2013. The import tax was hiked to 8% in June 2013 and 10% in August. Meanwhile, the government stipulated that dealers and banks pay cash in advance for imports in an attempt to prevent them from importing gold with credit and collecting payments from customers later. In July, India’s central bank announced that banks and dealers would be required to re-export at least 20% of their gold imports--that is, exporting the gold immediately after importing.
The mid-2013 policy push hammered imports, which declined from 162 metric tons in May to just 30 metric tons in June. Gold-hungry buyers made up some of the difference by recycling old jewelry, which usually accounted for about 10% of domestic supply in previous years. At the time of the July announcement, this was expected to rise 20%-30% for 2013.
Higher taxes also led to increased smuggling of gold. In the 2010-11 fiscal period, India’s Directorate of Revenue Intelligence reported 121 cases of attempted gold smuggling. In just two years, after the significant rise in the gold import tax, attempted smuggling rose to 885 cases.
Recognizing that the import tax was doing little to stem the underlying demand for gold, the government issued draft rules for a gold monetization plan in May 2015. Ideally, this scheme would allow the country to use the country’s large idle gold ounces already held in Indian households to supply its strong domestic demand, minimizing the need for imports. In this plan, owners would deposit gold at banks and earn interest. In turn, the bank could loan the gold to jewelers, who would use it to make and sell jewelry while paying the bank interest. Yet despite the potential upside of feeding India’s gold appetite and reducing its current account deficit, the plan faced many challenges.
First, gold depositors expected a certain level of interest payment to justify participation. On the other hand, of course, high rates would weaken the attractiveness of the program for banks accepting the gold deposits.
Second, while banks would be permitted to loan deposited gold to jewelers, the bank first would have to strip stones, melt jewelry, and test for purity to ensure quality. For depositors, gold received in the future may not be the same as the gold deposited. In addition, depositors would have to provide proof of ownership, which could prove particularly troublesome for the large “unreported” wealth in India, particularly if it’s multigenerational jewelry. These requirements added complications that weakened the program’s attractiveness for both banks and depositors.
Third, if a bank loaned all of the gold it took as deposits, it would be effectively short gold (it had sold it to jewelers, but still owes it to depositors). If all depositors attempted to withdraw from the bank at the same time, the bank could face a “gold crunch” where it would need to turn to the import market, likely creating a huge spike in the local premium. Proposed lockup periods could minimize the chances of this happening, but would also weaken the attractiveness of the program.
The program’s failure wasn’t terribly surprising. Similar programs had failed in the past. One such effort came in 1999 but failed because of low interest rates (just 0.75%-1%) and the requirement to deposit a minimum of 500 grams, an amount many middle-class homes couldn’t spare. While the newer program’s tax exemption and lower minimum make it more attractive, interest rates would have to be kept higher for it to work.
In February 2016, the government introduced a surprise 1% sales tax on gold. Although it only applied to jewelers with more than $2.2 million of annual turnover (about 50 kilograms of fine gold), the tax took effect almost immediately on March 1. On March 2, jewelers launched a protest strike that lasted 41 days. Nevertheless, the tax had a huge impact on gold imports: Gross imports declined 43% to 511 metric tons in 2016.
By the end of 2016, India was reported to be exploring cutting the import tax to 6% from 10%. On one hand, the country had made some progress. Gold purchases fell significantly because of higher prices, crackdowns on undisclosed income, and the government’s decision to withdraw old high-value bank notes. On the other hand, while total purchases had fallen, smuggling continued to rise. The World Gold Council estimates that 140-160 metric tons were smuggled in 2016, up from 120 metric tons in the prior year. The rise is particularly concerning, as India’s Directorate of Revenue Intelligence estimates that it only detects 5%-10% of smuggled gold. Smuggled gold avoids all taxes, robbing the government of tax revenue while failing to stem the adverse consequences on the rupee.
With the 1% sales tax added in 2016, the overall tax rate on gold jewelry had risen to 12.2%, composed of a 10% import tax, 1% excise tax, and 1.2% value-added tax. To simplify what had become a complicated tax system, India launched the goods and services tax in July 2017. The GST replaced the excise duty and value-added tax, but would continue to sit above the import tax. The GST was announced to be 3%, increasing the total tax from 12.2% to 13%. Though it’s higher than the taxes it replaces, the rate was lower than what the industry had feared. Despite the higher total tax rate, the GST allows firms to offset tax with input tax credits, avoiding double taxation throughout the supply chain. With uncertainty removed and a more simplified tax system in place, we think the market’s fears of more rate hikes will diminish.
Underlying Demand for Indian Gold Remains Strong We think underlying fundamentals of strong Indian demand remain, so demand should improve as uncertainty around taxes and near-term weather headwinds fade.
According to the International Labour Organization, India has yet to see the labor shift from low-productivity sectors like agriculture to high-productivity sectors akin to other developing nations in the region. As a result, while agriculture accounted for only 15.4% of India’s gross value added (2015-16 fiscal year), it accounted for nearly 50% of employment (2011-12 fiscal year). Excluding urban workers, agriculture’s share of employment rises to more than 60%.
With agriculture’s outsize impact on employment, many Indians’ incomes are largely affected by crop output. With the majority occurring roughly between July and September, rainfall has a huge impact on yields, as it provides critical water, especially to farmland that has no other form of irrigation. Weak rains result in weaker output and thus weaker incomes. And because gold is a discretionary purchase/luxury good, it is much less likely to be purchased when money is tight.
The past three years have seen significant shortages in rainfall, particularly in the southwest monsoon season. In 2014 and 2015, rainfall was 10% lower than the long period average from 1951 to 2000. In 2016, southwest monsoon rain improved, but it was still short of the average. In addition, post-monsoon-season rain was significantly lower than the long period average. The impact of weak rainfalls can be most readily seen in water-intensive crops like cotton. Despite a general improvement in yields, production declined significantly in the past few years, in step with the rain shortfall.
As the monsoon begins in India as we write, year-to-date rainfall has tracked well against historical standards. Through mid-July, Indian rainfall of roughly 340 millimeters is 1% higher than the long period average. Under more normalized weather, we expect crop production to improve, driving a return to better incomes for India’s rural population.
Gold is highly prized in India. From an investment perspective, gold is seen as a store of value that can be secured and transported easily. From a cultural perspective, it’s a symbol of wealth and status and is used in many Hindu and Jain ceremonies. For example, in Hinduism, first man and lawgiver Manu declared that gold ornaments should be worn for important ceremonies and occasions. In addition, gold is key to many regional festivals. India’s festivals intensify in the fall, beginning in September.
Gold is also considered a traditional gift for brides. Following the birth of a girl, families immediately begin saving for the stridhan, a gift of gold given to the bride for financial security in her marriage. Demographics portend a increase in marriages. Based on India’s 2011 census data, more than 40% of India’s 1.3 billion population is currently 25 years old or younger. In the 20- to 24-year-old cohort, less than half of Indians are married. However, marriage rates skyrocket to 78% for the 25- to 29-year-old cohort and rise to 90% for 30- to 34-year-olds. India’s young population provides a strong base for gold demand for years to come as marriages increase.
In Hinduism, it’s considered unfavorable to wed during Chaturmas, a four-month holy period that is typically from July to October. As a result, weddings tend to occur in October through December. Given that major festivals and weddings intensify in September and October, gold demand tends to rise in September. Because this follows the summer harvest, farmers’ incomes are boosted, giving them additional cash at the start of gold-purchasing season. This timing becomes especially important as nearly 70% of India’s population lives in rural areas, particularly dependent on agriculture.
Most of Our Gold Mining Coverage Is Fairly Valued Most gold miners we cover trade in line with their fair value estimates, especially when adjusted for uncertainty ratings. Equity market prices appear to reflect expectations that today's gold prices will extend into the long run.
Although we do not view any gold miners as overvalued, all stocks will face near-term pressure amid weakening ETF investment. Less profitable miners like
Leverage is not a significant concern for most gold miners. Amid healthy gold prices over the past couple of years, gold miners undertook steps to reduce debt, streamline operations, and improve profitability. Yamana Gold is the only miner that faces leverage issues, although it is working to improve its situation by fully divesting Brio Gold, its subsidiary that contains the disappointing Brazilian mines.
Although
/cloudfront-us-east-1.images.arcpublishing.com/morningstar/CFV2L6HSW5DHTFGCNEH2GCH42U.jpg)
/cloudfront-us-east-1.images.arcpublishing.com/morningstar/7AHOQA64TFEQDMYMIMM6VUHYLY.png)
/cloudfront-us-east-1.images.arcpublishing.com/morningstar/JA7LQ2INFNFTZFBJLSDUZGIPJQ.png)
:quality(80)/s3.amazonaws.com/arc-authors/morningstar/220f0649-85f9-4004-a281-b91d9bc53139.jpg)