
The Most Successful ETF Launch of All Time Raises Questions
JPMorgan Equity Premium Income ETF has been a magnet for investors. The question is whether they’ll stay the course.
/s3.amazonaws.com/arc-authors/morningstar/550ce300-3ec1-4055-a24a-ba3a0b7abbdf.png)

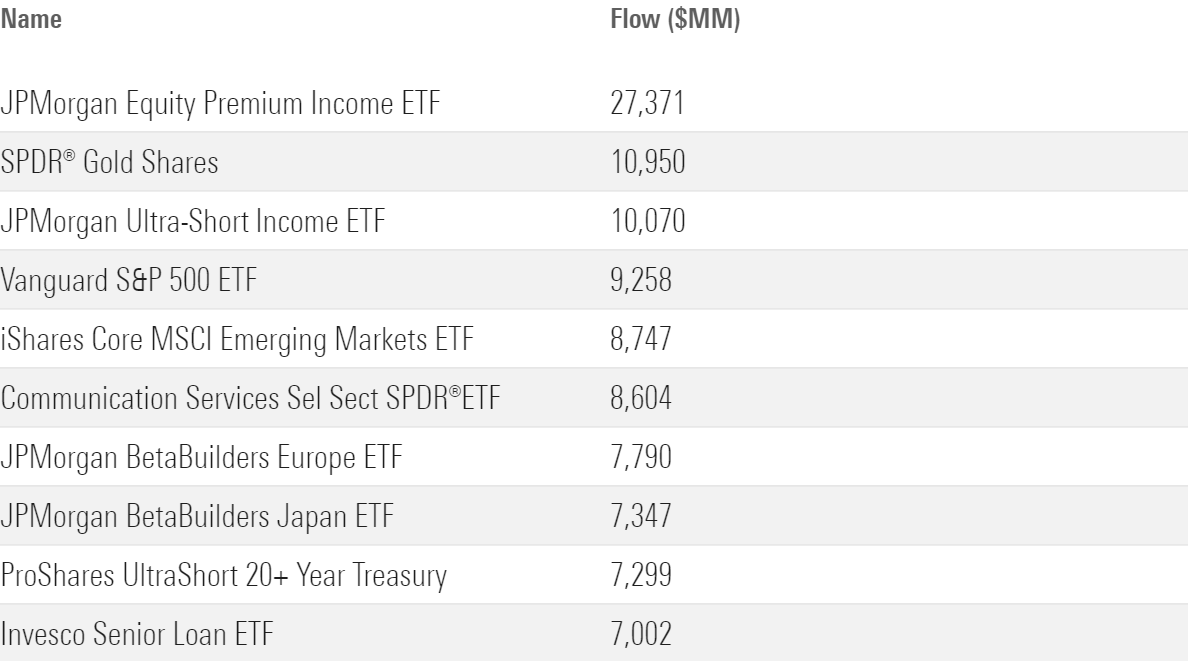
JPMorgan Equity Premium Income ETF JEPI has been a phenomenon since launching in May 2020. By our estimates, it gathered about $27 billion in net inflows in its first three years of existence, easily making it the most successful exchange-traded fund debut in history, as shown below.
Most Successful ETF Launches Based on Net Inflows in First 36 Months of Existence
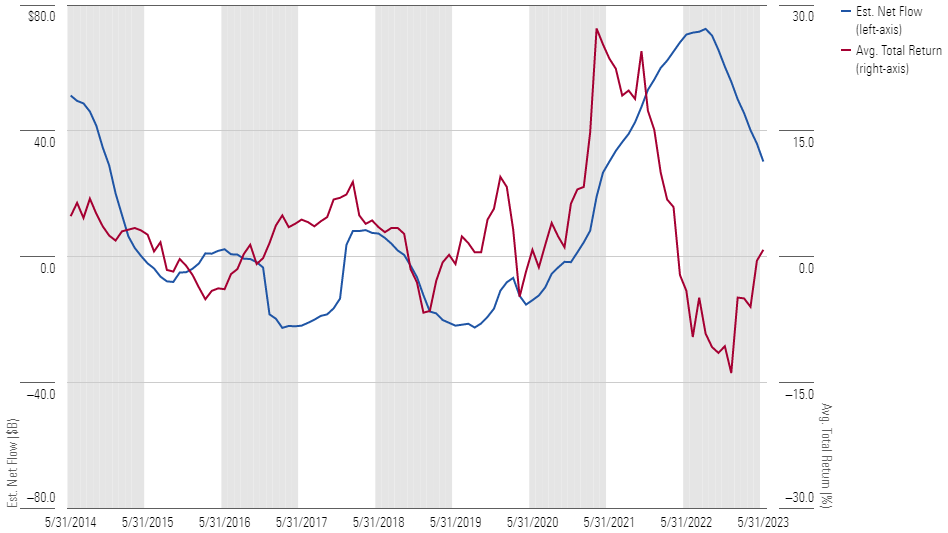
This is a boon to the ETF’s issuer, which stands to reap handsome profits from managing its billions in assets. But will it turn out as well for the ETF’s investors? After all, investors in alternative strategies like this one have done a poor job timing their purchases and sales. They’ve flocked to the funds following a good stretch of performance and fled when things have gone south, as illustrated below.
(Technically, the JPMorgan ETF is classified as a “non-traditional equity” strategy in our database, not as an “alternative” fund. But for the purposes of this study we are treating funds in non-traditional equity as alternatives, as non-traditional equity is home to approaches like long-short equity and options-driven strategies that have long been considered alternatives.)
Alternative Funds: Comparing Rolling 12-Month Estimated Net Flows Against Rolling 12-Month Total Returns (10 Years Ended May 31, 2023)
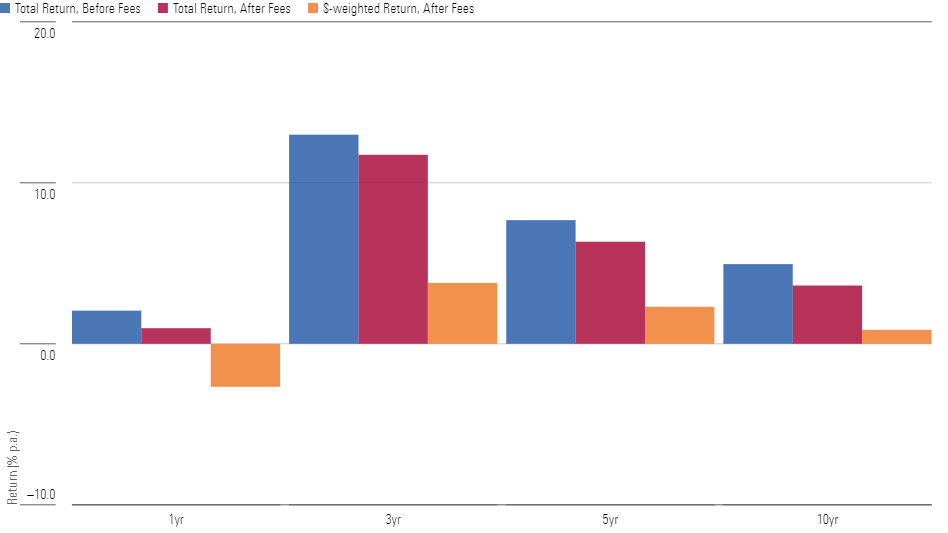
Consequently, investors in alternative funds have earned only a fraction of the funds’ returns over time. Over the trailing 10 years ended May 31, 2023, the average dollar invested in alternative funds earned less than 1% after fees, while the average fund returned about 3.6% after fees (5% before expenses).
Alternative Funds: Comparing Total Returns Against Dollar-Weighted Returns (as of May 31, 2023; Total Returns Weighted by Average Net Assets Over Trailing Period)
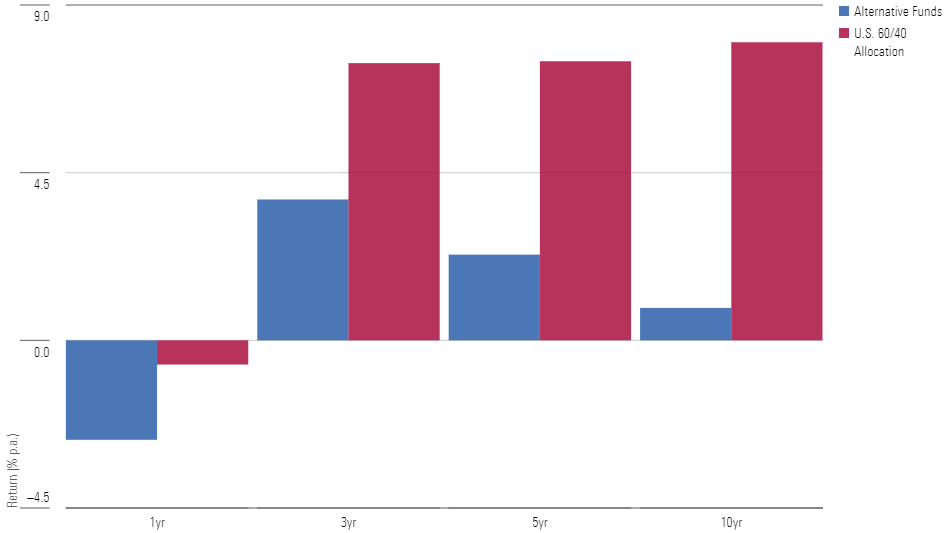
And while it’s true that the average alternative fund did outgain the U.S. 60/40 asset allocation over the trailing one-, three-, and five-year periods ended May 31, 2023, investors in the 60/40 allocation captured far more of its return than did those in alternative funds. As a result, the return of the average dollar invested in the 60/40 allocation (a proxy for which is Vanguard Balanced Index VBAIX) dwarfed that of the average dollar invested in alternative funds.
Alternative Funds: Comparing Dollar-Weighted Returns Against the Dollar-Weighted Returns of the U.S. 60/40 Allocation (as of May 31, 2023)
A Closer Look at JEPI
None of this is a knock on the JPMorgan ETF specifically. In fact, it has performed well since inception, posting total returns that slightly lag the S&P 500′s but with significantly less volatility. Moreover, the ETF boasts some attractive attributes, like its 0.35% expense ratio and relatively simple strategy of investing in S&P 500 constituents while writing call options to supplement income and mute volatility.
Nevertheless, given investors’ propensity to mistime their investments in alternative funds and this ETF’s meteoric rise, we thought it made sense to take a closer look at how investors have fared in it thus far. To that end, we estimated the ETF’s dollar-weighted returns over the trailing one and three years ended May 31, 2023, and compared them against its total returns, which are shown below.
Comparing JEPI's Trailing Total and Dollar-Weighted Returns (as of May 31, 2023)
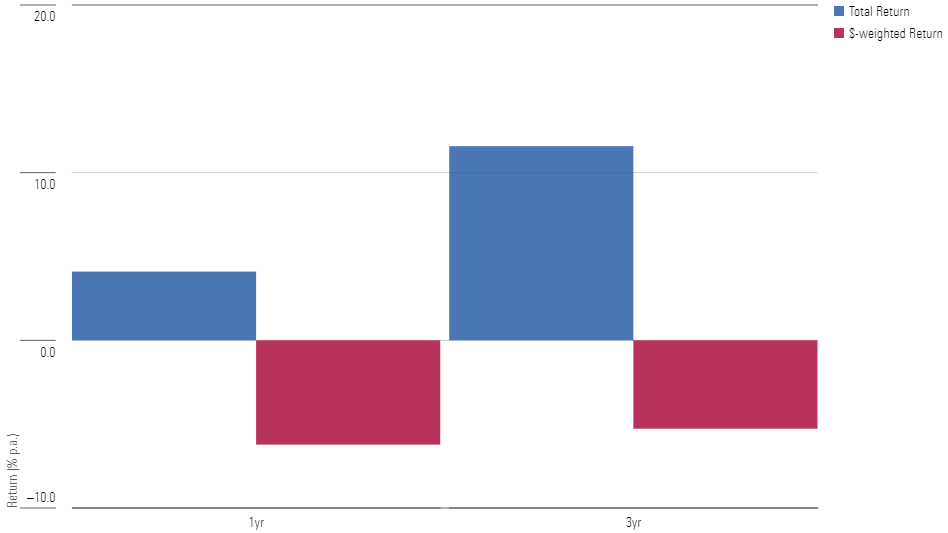
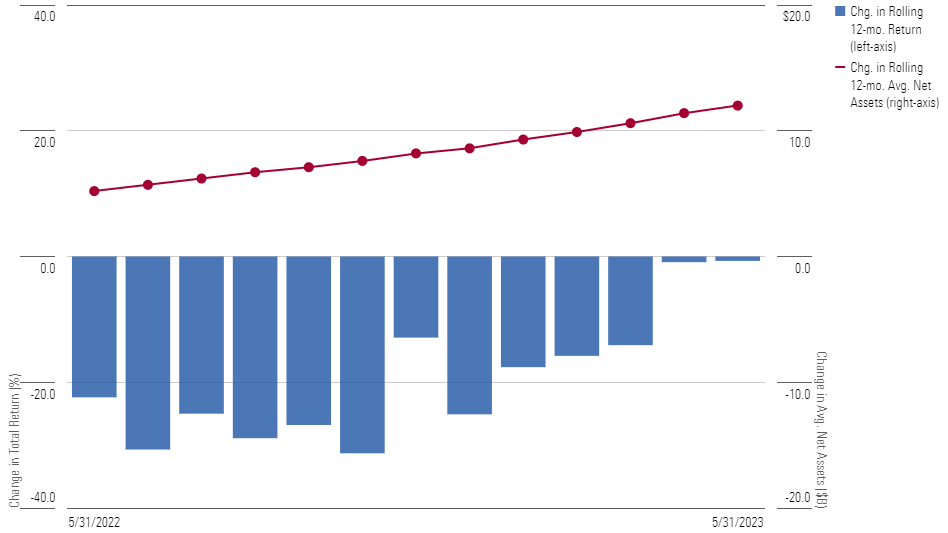
The average dollar lost money, while the ETF earned positive total returns. Essentially, the ETF roared out of the gate, notching an 18% total return in 2020 followed by a 22% total return in 2021, but total returns have been more or less flat ever since. However, because most of the assets poured in after the ETF had gone on its run—nearly $22 billion of its $27 billion in lifetime inflows came since 2021—that meant the fund’s size ballooned just as total returns were beginning to slide in absolute terms.
JEPI: Change in Rolling 12-Month Total Return Versus Change in Rolling Average 12-Month Net Assets (May 31, 2020-May 31, 2023)
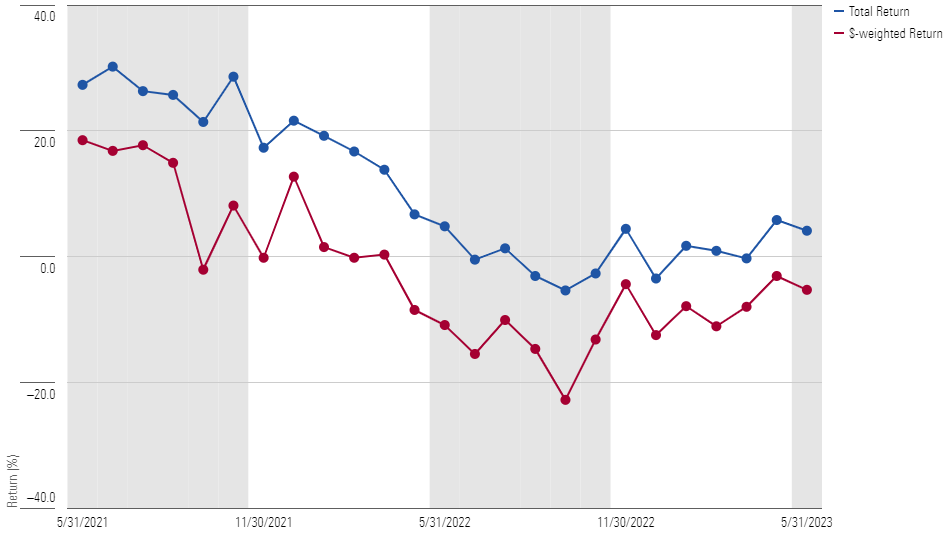
Thus, the ETF’s dollar-weighted returns have lagged its total returns virtually throughout its existence, as shown in the chart below, which compares the two over all rolling 12-month periods since inception. (Though we do not believe our estimates materially understate the ETF’s dollar-weighted returns over this period, it’s possible they don’t fully reflect income distributions the fund made. For further details, see the Note at the end of this article.)
Comparing JEPI's Rolling 12-Month Total Returns and Dollar-Weighted Returns (May 31, 2020-May 31, 2023)
The Outlook
Can investors in this ETF eventually earn a dollar-weighted return that approaches the fund’s time-weighted return? Yes, if they continue to shovel money into the ETF and returns trend higher, then their dollar-weighed returns would exceed the fund’s total returns—at least for a time—and that would close the gap that has formed. Even if investors were simply to hold on, the gap should narrow over time.
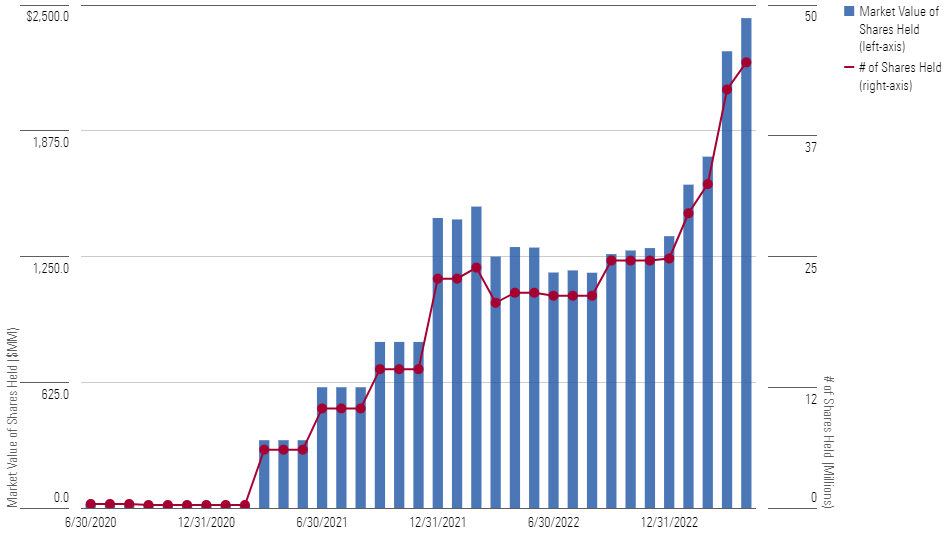
One reason for guarded optimism that investors will stay the course: The ETF isn’t held exclusively by individual investors. In fact, several other JPMorgan mutual funds own stakes that, taken together, totaled nearly $1 billion as of April 30, 2023. Moreover, it appears JPMorgan Chase & Co. JPM itself had invested about $1.5 billion in the ETF on behalf of the firm’s wealth-management clients as of March 31, 2023. To be sure, the ETF is hardly a creature of its fund siblings and wealth-management clients, which together accounted for less than 10% of its net assets. But their presence could stabilize demand compared with otherwise.
JEPI: Market Value of Shares Held by Other JPMorgan Funds and JPMorgan Chase (May 31, 2020-May 31, 2023)
Demand is also unlikely to evaporate because the ETF is held in a series of JPMorgan model portfolios that the firm offers. While it’s conceivable the firm could reduce or eliminate its allocation to the ETF in those portfolios, it at least ensures that the ETF is being used in a more strategic context and rebalanced back to target weight in a systematic manner.
Nevertheless, the chasm between the ETF’s total returns and dollar-weighted returns is worth monitoring. It seems to fit the pattern we’ve seen too often with other alternative funds, where investors pile in following a stretch of good performance only to be disappointed and eventually exit. While that isn’t foreordained in this case for the reasons mentioned, it warrants closer scrutiny going forward.
Note
It’s possible that our estimates of the ETF’s dollar-weighted returns somewhat understate what the average dollar actually earned—the reason being that the ETF routinely made income distributions, but those dividends weren’t necessarily reinvested back into the fund in a way that the dollar-weighted return calculation would capture.
But based on the fund’s regulatory filings, it seems unlikely that un-reinvested income distributions reconcile the difference between its total return and the return on the average dollar. From its inception through Dec. 31, 2022 (the date of the most recently filed semiannual report), the ETF earned a 13.4% total return per year but the average dollar lost around 8.8% annually.
For un-reinvested income to explain the roughly 22-percentage-point difference between the ETF’s annual total return and annual dollar-weighted return, income would need to account for a massive share of the fund’s assets. The ETF saw more than $18 billion in net inflows from inception through Dec. 31, 2022, and thus its monthly net assets averaged around $5.2 billion. Over that full span, the ETF earned $1.5 billion in net income, with income typically accounting for only about 3%-8% of average net assets.
In other words, even if we were to assume that un-reinvested income wasn’t being captured in our estimate of the ETF’s dollar-weighted returns, the fund’s income was not nearly a large enough share of its net assets to reconcile the difference between the fund’s total return and its estimated dollar-weighted return to begin with.
The author or authors do not own shares in any securities mentioned in this article. Find out about Morningstar’s editorial policies.
/cloudfront-us-east-1.images.arcpublishing.com/morningstar/MNPB4CP64NCNLA3MTELE3ISLRY.jpg)
/cloudfront-us-east-1.images.arcpublishing.com/morningstar/CGEMAKSOGVCKBCSH32YM7X5FWI.png)
/cloudfront-us-east-1.images.arcpublishing.com/morningstar/OMVK3XQEVFDRHGPHSQPIBDENQE.jpg)
:quality(80)/s3.amazonaws.com/arc-authors/morningstar/550ce300-3ec1-4055-a24a-ba3a0b7abbdf.png)