
Hello From the Other Side of MLP Investing
After five years of strong returns, MLP CEF investors are rolling in deep losses.
/s3.amazonaws.com/arc-authors/morningstar/af89071a-fa91-434d-a760-d1277f0432b6.jpg)
There's always a bear market somewhere, and this year that ignoble distinction goes to the energy limited partnership Morningstar Category. Closed-end fund MLP holdings, which are primarily involved in the storage and transportation of commodities like oil and natural gas, have been beset by both the crash in energy and commodity prices, most notably oil, and the looming threat of rising interest rates in the United States. That dual threat has caused some severe losses across the category. The average energy limited partnership CEF's net asset value has fallen by 31% this year through the end of October, the worst performance of any CEF category over that time period.
It has been a stark fall for what was one of the fastest-growing and strongest-performing categories of the closed-end universe and a harsh reminder of the dangers of chasing income at any price.
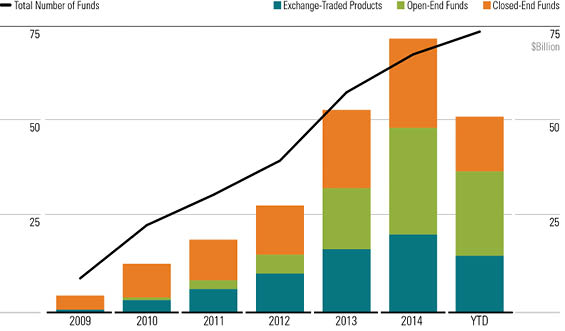
The first MLP CEFs launched in 2004, but the asset class didn't start garnering widespread attention until after the financial crisis when the Federal Reserve's zero-bound interest-rate policy left investors scrambling for new sources of investment income. MLPs have historically offered yields in the 5% to 6% range, which is particularly attractive compared with 10-year bonds that are trading at closer to 2%. When those yields are combined with the leverage employed by most CEFs, it can create tantalizing distribution rates.
The CEF industry wasted no time seizing the opportunity once interest rates reached their current historically low levels; 18 of the 26 CEFs in the category were launched after 2008. Not surprisingly, other vehicles were quick to follow suit. The first exchange-traded note that offered access to MLP returns,
The product proliferation came during a strong period for MLPs. From 2009 through the end of 2014, the Alerian MLP Index, which tracks the 50 largest MLPs, gained 16.7% annualized, easily topping the Morningstar Energy Index's 9.4% annualized gain over the same time and, more impressively, the Morningstar US Market Index's 15.6% annualized gain. The securities were boosted by a combination of increased interest from income-seekers and a surge in domestic energy production, which directly impacts the volume of commodities that need transportation. Unfortunately, both those tailwinds have turned into headwinds this year.
- source: Morningstar Analysts
Energy production has slowed along with the falling price of energy commodities. As of September, U.S. production was down 5% from its peak in March 2015 and Morningstar equity analysts expect production to decline another 10% to 15% in 2016. Output isn't expected to reach the same level as this March until 2017 at the earliest and possibly even as late as 2018. That's going to put pressure on MLP distributions, and there are already signs of stress, with cash distribution coverage ratios falling below 1.0 at some MLPs, such as
No MLP CEFs have lowered their distributions to date, but clearly there is going to be downward pressure going forward. As it stands, the average MLP CEF had an attractive distribution rate of 10% based on share price as of Nov. 9.
Rising interest rates pose another threat to MLP CEFs. While no one can predict the timing and magnitude of the eventual rise in interest rates, consensus seems to be building around a December rate increase. A rise in rates would be a negative for MLP CEFs for a number of reasons. Since most of the interest in MLPs is geared around their attractive income, higher risk-free rates could make less risky forms of fixed income more attractive. Higher interest rates would also lead to higher financing costs for both the MLPs and the CEFs themselves. Because some MLP CEFs finance leverage based on short-term, variable interest rates, a rise in rates would mean higher leverage costs, which could affect the fund's ability to meet distribution payments at their current levels.
Morningstar initiated coverage on a number of the energy limited partnership funds this year. We currently cover five CEFs in the category, two of which receive Morningstar Analyst Ratings of Bronze. The two funds,

- source: Morningstar Analysts
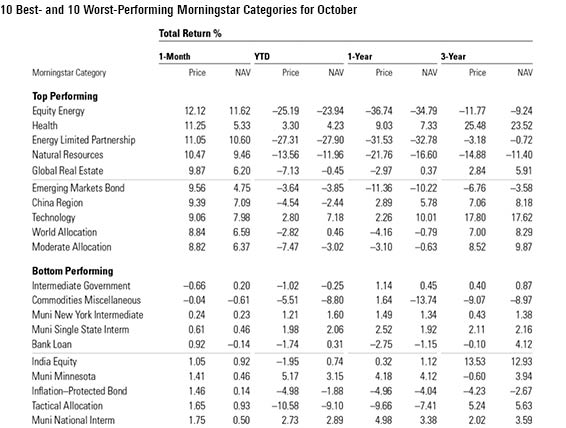
With the significant drop in MLP valuations over the last year, many MLP CEFs do look attractively valued (even without z-statistics below negative 2.0), and the distribution rates at share price are especially compelling. That said, there are numerous risks, and we outlined two significant ones above. Investors with a contrarian bent may find this asset class attractive, but they should proceed with caution. Best- and Worst-Performing CEF Categories October saw a rebound in share prices of energy and master limited partnership CEFs, with both categories landing on top of the month's top-performing list. The average MLP CEF gained nearly 11% on share price last month, though it was down 27% for the year to date through October. Outside of energy and commodities, healthcare CEFs were top performers last month even after years of impressive returns. The average healthcare CEF gained 11% on share price and 5% on underlying NAV last month. The average healthcare CEF gained 25% on share price over the trailing three years and 23.5% on NAV. Exhibit 3 lists the 10 best- and 10 worst-performing Morningstar Categories for October, ranked by share-price return.
- source: Morningstar Analysts
Most Expensive and Inexpensive CEFs Exhibit 4 lists the 10 most inexpensive CEFs based on three-year z-statistics as of Oct. 31. The z-statistic measures how many standard deviations a fund's discount/premium is from its three-year average discount/premium. For instance, in these tables, a fund with a z-score of negative 2 would be two standard deviations below its three-year average discount/premium. Funds with the lowest z-scores are classified as Relatively Inexpensive, while those with the highest z-scores (not shown in Exhibit 4) are Relatively Expensive. We consider funds with a z-score of negative 2 or lower to be "statistically undervalued" and those with a z-score of 2 or higher to be "statistically overvalued."
Thirty-four CEFs looked undervalued (a z-statistic of negative 2.0 or lower) as of Oct. 31, and most were in equity categories. Interestingly, no MLP CEFs looked undervalued, though the declining share prices have been similarly matched by declines in net asset value over the past year or so. Small-cap Royce Value Trust RVT was the most undervalued with a three-year z-statistic of negative 3.07, though ASA Gold and Precious Metals ASA was a close second with a z-statistic of negative 2.98.

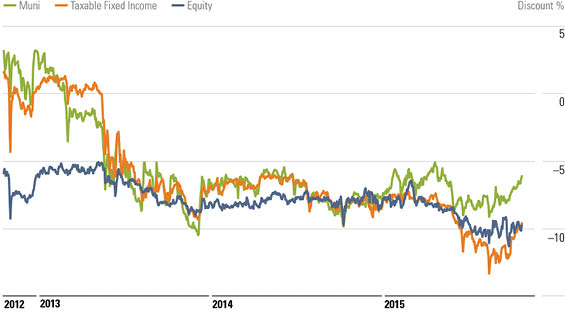
Discounts & Premiums After months of widening discounts for the three broad categories of CEFs (equity, taxable bond, and municipal bond), October saw a narrowing of each category's average discount. Equity CEFs saw their discounts shrink 81 basis points on average last month as the S&P 500 saw an 8.4% bounce in October. The average taxable bond saw its discount narrow by nearly 2.3 percentage points after the Fed, once again, delayed a rate hike. Municipal bond CEFs also saw a significant narrowing of the funds' average discounts (185 basis points). The average discount for equity and taxable-bond CEFs is wider than the start of 2015, but munis have seen an average discount narrowing over the year so far, proving once again that tax-advantaged distribution payments keep investors interested. Exhibit 5 shows the average discounts for the three broad categories for the past three years.
- source: Morningstar Analysts
/cloudfront-us-east-1.images.arcpublishing.com/morningstar/OMVK3XQEVFDRHGPHSQPIBDENQE.jpg)
/cloudfront-us-east-1.images.arcpublishing.com/morningstar/AGAGH4NDF5FCRKXQANXPYS6TBQ.png)
:quality(80)/s3.amazonaws.com/arc-authors/morningstar/af89071a-fa91-434d-a760-d1277f0432b6.jpg)