
How Well Have Large-Blend Funds Performed? It Depends.
A look at different approaches to calculating a category's average return.

How well have large-blend mutual funds performed during the past 10 years? That question is not as easy to answer as it might seem. At face value, the average trailing 10-year return for all mutual funds currently in the large-blend Morningstar Category was 5.97% at the end of September 2015. Not too shabby--considering the tremendous volatility the markets have experienced during the past decade. This number is displayed as the category average return in the Performance tab for individual funds on Morningstar.com. But more important than knowing what this figure is, or where it can be found, is understanding how it is calculated.
Digging a Little Deeper The category average trailing 10-year return figure only accounts for funds that currently reside in the large-blend category. It does not know where these funds fell in our category system 10 years ago, nor does it care where they've been in the intervening decade. For example, what is today a large-blend fund might have been a mid-cap value fund at some point over the past 10 years. Also, the calculation only includes funds that survived the full 10 years. Nonsurviving funds are dropped from the calculation because they do not have a full 10-year return and thus cannot be included for purposes of calculating an average of trailing 10-year returns.
One way we can address survivorship bias is to calculate the average return of all funds in the category each month. If a fund does not survive, its monthly returns will still be included, at least up until the month prior to its closure. We can then string together these monthly returns, compounding them to get a 10-year average return. Calculating returns this way results in a trailing 10-year return for the large-blend category of 5.62%.
This number is different from the 5.97% average trailing return for two reasons. First, it includes funds regardless of whether or not they survived to see the next month. Secondly, it includes in its monthly average funds that are categorized as large blend in any given month, regardless of their category membership in previous or future months. Not surprisingly, many funds that merge or liquidate have poor performance, so including these funds, at least up to the month prior to their closure, results in a lower average return for the category. This method of compounding the monthly average return gives a better idea of a large-blend investor’s actual experience during the past decade.
Painting a More Accurate Picture However, even this average gives an incomplete picture because it yields a single number, one that tells us nothing about the distribution of returns. A histogram is a great way to visualize the range of returns. The histogram below includes only those funds that started in the large-blend Morningstar Category and survived 10 years. The bars representing those funds that lagged the 6.80% annualized return of the S&P 500 over the period appear in red. Bars representing those funds that beat the S&P 500 appear in blue.
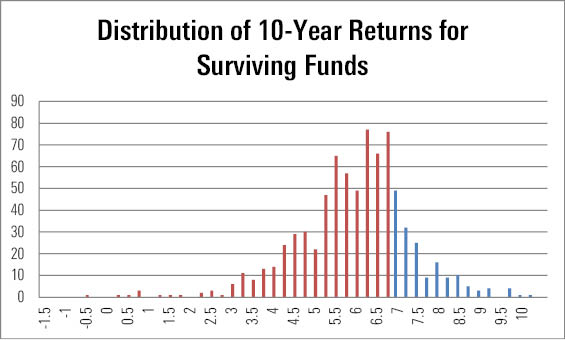
- source: Morningstar Analysts
We need to make some simplifying assumptions in order to incorporate nonsurviving funds into the analysis. One solution is to assume that, after a fund closes, an investor reinvests in an average fund in the large-blend category and thus receives the category average return for the remainder of the period. If a fund does not survive, its returns will be included up until the month prior to its closing, and thereafter we assume it will generate a return equivalent to the average of other large-blend funds. Accounting for missing returns this way results in an average 10-year return for nonsurviving funds of 5.22%. The fact that this is less than the 5.62% category average return suggests that nonsurviving funds tend to be poor performers. After adjusting for survivorship bias, an even smaller percentage of funds was able to beat the S&P 500 during our period of study, as seen in the histogram below.
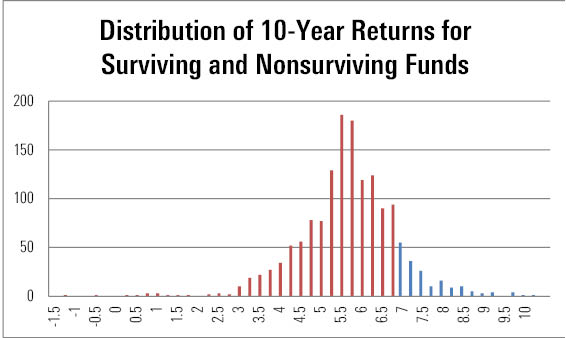
- source: Morningstar Analysts
Before including these nonsurviving funds, 20% of the surviving large-blend funds that existed 10 years ago went on to beat the S&P 500. These funds are represented by the blue bars in the right tail of the first histogram. After making some simplifying assumptions to include nonsurviving funds in this analysis, just 10% of the large-blend funds that existed 10 years ago went on to beat the S&P 500 (represented by the blue bars in the right tail of the second histogram). It should come as little surprise that very few of the nonsurviving funds had good returns.
In summary, there are a lot of details that go into something as seemingly simple as calculating a category average return. These details are important when trying to determine how funds have truly fared against their competitors as well as their benchmarks.
Disclosure: Morningstar, Inc.’s Investment Management division licenses indexes to financial institutions as the tracking indexes for investable products, such as exchange-traded funds, sponsored by the financial institution. The license fee for such use is paid by the sponsoring financial institution based mainly on the total assets of the investable product. Please click here for a list of investable products that track or have tracked a Morningstar index. Neither Morningstar, Inc. nor its investment management division markets, sells, or makes any representations regarding the advisability of investing in any investable product that tracks a Morningstar index.
The author or authors do not own shares in any securities mentioned in this article. Find out about Morningstar’s editorial policies.
/cloudfront-us-east-1.images.arcpublishing.com/morningstar/RSZNI74R6FG7FDSWBUF6EWKDE4.png)
/cloudfront-us-east-1.images.arcpublishing.com/morningstar/AGAGH4NDF5FCRKXQANXPYS6TBQ.png)
/cloudfront-us-east-1.images.arcpublishing.com/morningstar/NPR5K52H6ZFOBAXCTPCEOIQTM4.png)