
Target-Term Funds: What's Old Is New Again in CEFs
Target-term funds are back in fashion.

/s3.amazonaws.com/arc-authors/morningstar/af89071a-fa91-434d-a760-d1277f0432b6.jpg)
Closed-end funds that target end-dates are making a comeback. All three of the CEF IPOs in 2017 are target-term funds, and 12 of the last 14 IPOs dating back to 2015 had a target-term. Target-terms may seem like the latest trend in CEF land; they aren't particularly new, although they did disappear for a while. BlackRock launched one in 1991 with a wind-up provision in 1998, for example. More than two dozen target-term CEFs were launched between 1991 and 2003, but it wasn't until almost a decade later that target-term funds made a comeback.
Target-term funds are issued with windup provisions that typically promise a per share liquidation value at a specified future date. Recently launched term funds tend to have term dates about seven years from inception. In theory, the windup provisions should keep discounts narrow, particularly as the term date approaches. This sounds like a nice benefit for investors who are wary of CEF's discounts and premiums.
One potential issue for investors in such funds, however, is that, as the term date approaches, it is likely that the fund's distribution shrinks. There are two primary reasons for this. First, the funds may use leverage when launched, but as the term date nears, the portfolio is often deleveraged to ensure the liquidation value can be met. Lower leverage means a lower payout.
Second, term funds often invest first in intermediate maturity bonds, then reinvest those proceeds in shorter maturity bonds as the term date approaches. Shorter maturity bonds have lower yields, thus the distribution rate will shrink over time. Take BlackRock Municipal 2018 Term Trust BPK, which aims to return $15 per share at the end of 2018 (though this is not guaranteed). The fund was launched in 2001, and its first full-year distribution (2002) was $0.78 per share. That distribution was maintained through 2005, then jumped a bit higher for a few years. From 2012 to 2016, the distribution shrank to $0.38 from $0.94 per share. The fund's 2016 distribution of $0.38 per share pales in comparison to its muni national intermediate Morningstar peer average of $0.56. These funds could certainly hold bonds maturing after the term date to maintain a high distribution (or maintain leverage in the portfolio), but that would put the fund's ability to return the promised liquidation value at risk, particularly if the term date coincides with a rough patch in the bond market.
It's important to consider total return, not simply distribution rate, when evaluating a CEF. Note that, at launch, these funds often fall into long duration categories, but as they near the term date, the portfolios shorten in maturity and the funds may change categories, making longer-term peer comparisons somewhat muddled. BlackRock Municipal 2018 Term Trust made the jump from the long national muni Morningstar Category to intermediate in early 2013, so five-year returns are a reasonably appropriate comparison. The fund was the worst-performing among its peers over that time, gaining less than 3% on net asset value (2% on share price) versus the peer average of nearly 3.5% for both NAV and share price. As for discounts, BlackRock Municipal 2018 Term Trust traded near its NAV as of the end of April, which was in line with its average peer.
Target-term funds do have some benefits, but there's a cost. Investors should focus on a fund's total return prospects over the long-term investment horizon and not be swayed by the latest trend.
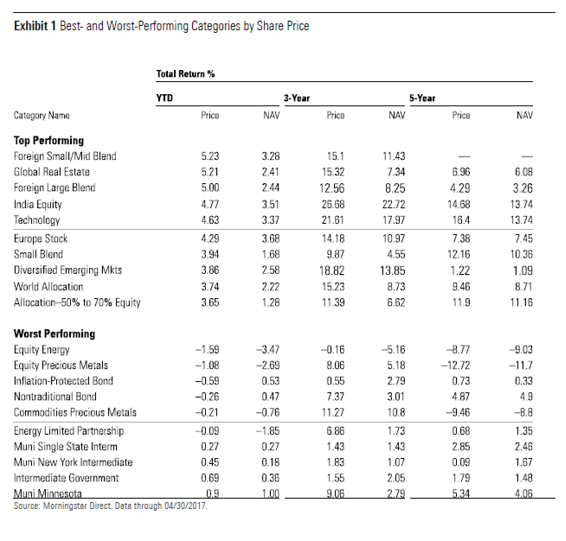
Best- and Worst-Performing Categories The global stock market did well last month, and the four best-performing CEF categories in April invested primarily outside the United States. A renewed sell-off in oil prices pushed energy stocks and commodities down, and the two worst-performing categories last month primarily invested there. Exhibit 1 lists the best- and worst-performing CEF categories for the month of April, ranked by share price return.
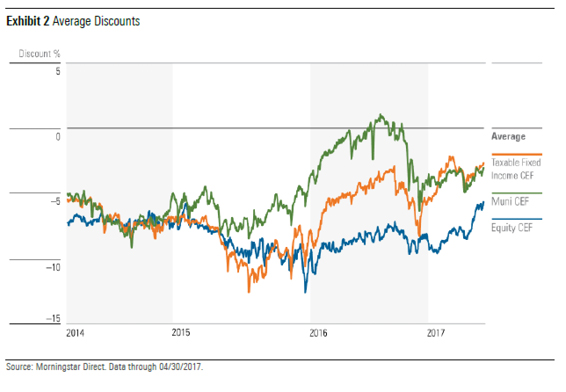
CEF Discount Trends All three CEF asset classes ended the month of April with narrower discounts than where they started. Equity CEFs narrowed the most, from an average 7% discount at the beginning of the month to around 5.6% at the end. The difference between taxable- and municipal-bond CEFs continued to narrow, and the two moved in lock step between the 11th and 18th. The absence of any significant spread between taxable- and municipal-bond discounts suggested that investors were uncertain about where to price the two asset classes. That week, the 10-year U.S. Treasury fell to its lowest yield since mid-November (2.2%), and Treasury futures markets felt less certain about the magnitude of a June rate hike. On April 18, the CME Group reported a 42% chance of a rate hike of 100-125 basis points, down from what had been a yearly high of 67% on April 6. As of early May, the probability of a rate hike in the 100-125 basis-point range was about 87%. Exhibit 2 shows the average discounts for the three major CEF asset classes for the trailing three-year period.
Valuations We use a z-statistic to measure whether a fund is "cheap" or "expensive." As background, the z-statistic measures how many standard deviations a fund's discount/premium is from its three-year average discount/premium. For instance, a fund with a z-statistic of negative (positive) 2 would be two standard deviations below (above) its three-year average discount/premium. Funds with the lowest z-statistics are classified as relatively inexpensive, while those with the highest z-statistics are relatively expensive.
We consider funds with a z-statistic of negative 2 or lower to be "statistically undervalued" and those with a z-statistic of positive 2 or higher to be "statistically overvalued." Typically, we prefer to use the three-year z-statistic, which shows the funds that are most heavily discounted relative to their prices over the past three years.
As of the end of May, no CEFs were statistically undervalued. This has been the case for some time as discounts have generally narrowed across the CEF universe. Bargain-hunters must continue to be patient.
Alaina Bompiedi contributed to this article.
/cloudfront-us-east-1.images.arcpublishing.com/morningstar/T2LGZCEHBZBJJPPKHO7Y4EEKSM.png)
/d10o6nnig0wrdw.cloudfront.net/07-12-2024/t_385b0026f5e84a9da4b48f29c3774fdc_name_file_960x540_1600_v4_.jpg)
:quality(80)/s3.amazonaws.com/arc-authors/morningstar/af89071a-fa91-434d-a760-d1277f0432b6.jpg)