
There's A Fire (Sale) in Bond CEFs
Stock market volatility has sent taxable-bond CEF share prices spiraling downward, but is this the best deal since the financial crisis?
/s3.amazonaws.com/arc-authors/morningstar/af89071a-fa91-434d-a760-d1277f0432b6.jpg)
August's spike in stock market volatility has pushed taxable-bond closed-end fund share prices further from their net asset values, and many have reached discounts not seen since the financial crisis. As tempting as the current discounts might seem, there are some important factors to consider. This edition of Morningstar's CEF Monthly will examine how the current environment compares with past periods of share price dislocation and how some of our Morningstar Medalist CEFs have fared.
Global equity markets were rocked in late August after China acted to devalue its currency. Fears of a slowdown in the growth of China's economy quickly spread to developed markets.
The volatility caused the average discounts across all major CEF asset classes to widen during the month, though equity CEFs only saw a slight widening, on average, over the month. The chart below shows the average discount for equity, taxable-bond, municipal bond, and other CEFs over the past three years.

- Source: Morningstar
The most notable of the four broad category groups was the taxable-bond universe. The average discount for taxable-bond funds has widened almost 400 basis points over the course of the year to 11.3% from 7.8% and widened more than 90 basis points last month. That's the widest discount that group has traded at since March 2009, when the average discount hit 18%. That wasn't the worst of it for taxable-bond CEFs--in October 2008, the average discount crashed to an eye-popping 30%. Exhibit 2 shows the average daily discount for taxable-bond CEFs from January 2006 to August 2015.

- Source: Morningstar
The extreme average discount didn't persist for very long. By March 2010, the large discount dissipated and the average taxable-bond CEF was trading at a discount of less than 1%.
Although historically it has paid off for investors to jump in when discounts get to extremes, it's not always a smooth ride nor is one period's extremes necessarily the same as another period's. Betting on wide discounts is basically a bet that they will revert to a more "normal" level, but market forces play a big role in what that "normal" discount actually is.
The uncertainty over when the Fed will raise interest rates makes the current "normal" discount for bond CEFs likely much different than in previous periods. For instance, even though taxable-bond CEFs generally traded at or slightly above their NAV for most of the previous seven years, the average fund hasn't traded at a premium to NAV since May 2013, when the "taper tantrum" hit. With the threat of rising interest rates still hovering over fixed-income funds, it's likely that a "normal" trading range for shares relative to NAVs could be lower than it has been in the past.
One tool to weed out the noise in discount movements is a fund's z-statistic. The z-statistic measures how many standard deviations a fund's discount/premium is from its one-year average discount/premium. For instance, a fund with a z-statistic of negative 2 would be 2 standard deviations below its one-year average discount/premium. We consider funds with a z-statistic of negative 2 or lower to be "statistically undervalued" and those with a z-statistic of 2 or higher to be "statistically overvalued."
At the start of 2015, only 17 of the roughly 150 taxable-bond CEFs were trading at discounts that looked undervalued based on one-year z-statistics. As of the end of August, almost half of the funds in the category were sporting z-statistics of negative 2 or less. Exhibit 3 shows the 10 most undervalued taxable-bond CEFs based on the one-year z-statistic.

Z-statistics aren't perfect indicators. While it's true that a lot of CEFs do look attractive now, there's nowhere near the dislocation the market saw in October 2008. In fact, at the market bottom, only three CEFs didn't look undervalued based on their one-year z-statistics. The median z-statistic at that time was negative 5.04, which means the median CEF was trading 5 standard deviations away from its average discount or premium over the trailing one-year period. In a normal distribution of returns, a 5-sigma event like that occurs naturally every couple thousands of years, so it's difficult to overstate how incredibly dislocated share prices were from NAVs during that period.
Interestingly, two periods that do look relatively similar to the current environment are October 2007 and June 2013, neither of which turned out to be exceptional buying opportunities in general. Exhibit 4 shows the dispersion of one-year z-statistics at the month-end of October 2007, October 2008, June 2013, and August 2015.
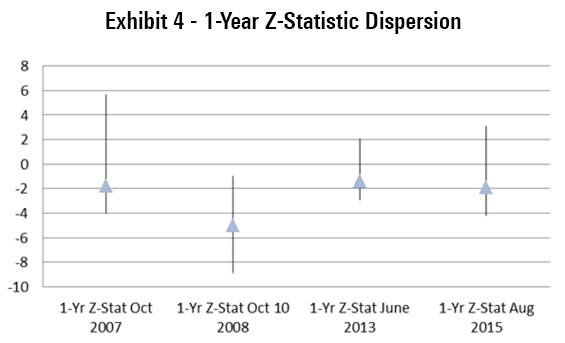
- Source: Morningstar
As the exhibit shows, discounts may currently be enticing on an absolute basis, but the median z-statistic of negative 1.89 is right in line where it was in October 2007 (negative 1.80) and in June 2013 (negative 1.42). The most undervalued taxable-bond CEF at the end of August was Western/Claymore Inflation-Linked Opportunities WIW, which had a one-year z-statistic of negative 3.31, is still not as relatively cheap as the median taxable-bond CEF was trading in October 2008.
The current buying opportunity may be stronger than usual, but long-term investors should still focus on finding good managers first and attractive valuations second. With that in mind, there are some bargains to be found among our favorite taxable-bond CEFs. Among the 11 taxable-bond CEFs that earn Morningstar Analyst Ratings of Bronze, Silver, or Gold, five look relatively undervalued based on one-year z-statistics, although only one looks undervalued based on a three-year measure. Exhibit 5 lists these funds and relevant performance data.

News You Can Use A Win for Activists
There are other routes to narrower discounts than betting on markets eventually normalizing. In early August, the board of directors of
Karpus put forth a proposal to open-end the fund at a 2014 shareholder meeting after criticizing the fund's persistent discount (its three-year average discount as of the end of August was 10%). Although that proposal was ultimately defeated after gaining just one third of shareholder votes, the fund's shareholders voted on another Karpus proposal for a self-tender offer at a mid-April 2015 shareholder meeting, which was approved by shareholders. The nonbinding proposal required the board to consider authorizing a self-tender offer for all outstanding common shares at or near NAV. If more than 50% of outstanding common shares were tendered, the board would cancel the tender offer and take steps to convert or merge the fund into an open-end fund or liquidate it.
After the upcoming vote was announced, the fund's discount narrowed to 4% from 9.6%, its slimmest discount to NAV since 2009, and has stayed around 4% even as many peers have seen discounts widen considerably in August. The fund, which previously earned a Morningstar Analyst Rating of Silver, was placed Under Review.
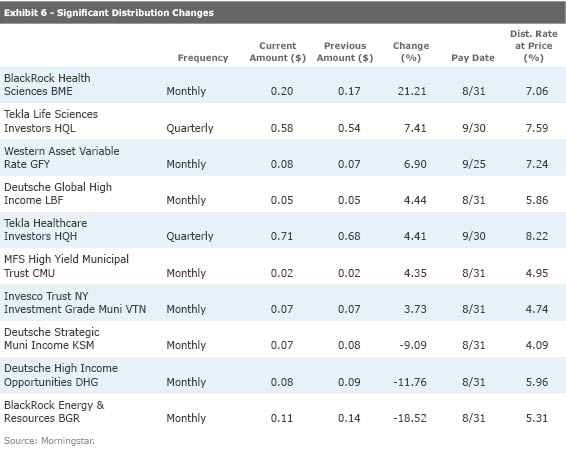
The table below lists significant distribution changes during August.
/cloudfront-us-east-1.images.arcpublishing.com/morningstar/OMVK3XQEVFDRHGPHSQPIBDENQE.jpg)
/cloudfront-us-east-1.images.arcpublishing.com/morningstar/AGAGH4NDF5FCRKXQANXPYS6TBQ.png)
:quality(80)/s3.amazonaws.com/arc-authors/morningstar/af89071a-fa91-434d-a760-d1277f0432b6.jpg)