
MLPocalypse Averted for Now
Have MLP closed-end funds finally hit bottom?

/s3.amazonaws.com/arc-authors/morningstar/af89071a-fa91-434d-a760-d1277f0432b6.jpg)
This month, we highlight some of the issues master limited partnership closed-end funds have faced in the past year and a half (and are likely to face in the future as the volatility in sentiment and oil prices is far from over). We discussed some of these concerns in the November CEF Monthly and will build on them here.
After a tough year and half for energy MLP CEFs, the funds made a huge turnaround in late February that has continued into the early days of March. During the first two weeks of February, the funds' losses were unrelenting; the average MLP CEF posted a nearly 18% loss of net asset value between Feb. 1 and Feb. 12 as oil prices dropped to $29 per barrel from about $32. The price for Cushing OK West Texas Intermediate crude touched $26 per barrel in early February, a low not seen since the early 2000s. This seems to have been a turning point for MLP CEFs--the average fund gained nearly 18% in the final two weeks of the month (ending with an average loss of just over 1% for the month) and oil ended February at nearly $33 per barrel. The Alerian MLP Index, which tracks the 50 largest MLPs, and the average open-end MLP fund saw a similar, though less volatile, return pattern.
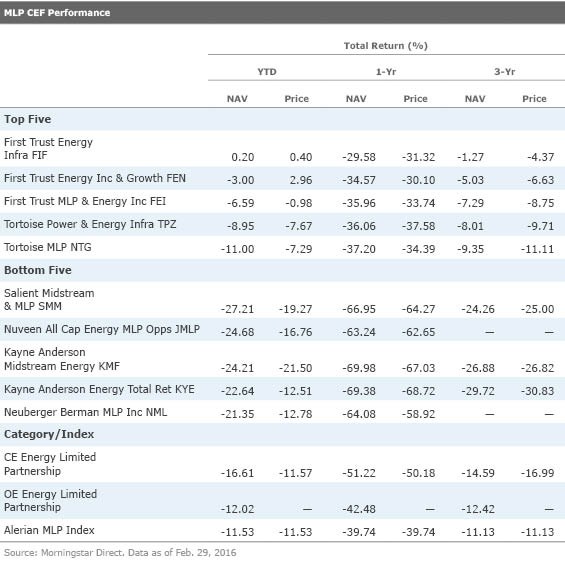
Exhibit 1 shows the top five and bottom five performing MLP CEFs for the year to date through February. The severe performance discrepancies between some funds can be largely explained by their holdings. For example, First Trust Energy Infrastructure Fund FIF has a 40% allocation to utilities, which has helped buoy returns on a relative basis during the trailing year. Utilities have outperformed the Alerian MLP Index by roughly 45 percentage points during that time period. Still, a 30%-plus drop in NAV and share price during the past year stings.
MLP CEFs: An Overview Taking a step back, a quick review of some basics of MLP CEFs is in order before diving deeper into the current state of the funds. Not all vehicles calling themselves "MLP CEFs" are in fact MLP-focused. For tax reasons, some MLP CEFs are structured as regulated investment companies, or RICs. With the RIC structure, a fund pays no taxes but instead passes the tax consequences of its investment portfolio to the fund's shareholders. This is the classic fund setup that applies to most open-end mutual funds and CEFs. But the RIC structure prohibits funds from investing more than 25% of assets in MLPs; as a result, MLP-focused CEFs structured as RICs are not truly MLP-focused. Their portfolios invest in MLPs and other high-yielding energy infrastructure securities.
A true MLP fund structures itself as a C-corporation, which means the CEF pays taxes (it is taxed at the corporate level) and fundholders pay tax on distributions. This is the most common way to structure an MLP CEF. Because the funds invest almost exclusively in MLPs, most of the distributions they receive from their portfolio holdings are return of capital, which arises because energy MLPs distribute this to their limited partners to maintain their own tax status. Return of capital lowers the cost basis of the investment, so, at the fund level, there isn't much tax to pay. Taxes from return of capital are only paid when the investment providing that return of capital is sold from the portfolio.
Deferred Tax Liabilities Most funds (and companies) that pay taxes have net deferred tax liabilities, or DTLs, used to reconcile estimated temporary differences arising from generally accepted accounting principles and tax accounting methods. If the fund liquidated or sold every holding in the portfolio, the liability becomes the amount of tax owed. As unlikely as it is that the fund would realize the full tax burden in any year, the liability is still subtracted from the CEF's NAV. Recall that NAV is equal to a fund's assets minus liabilities.
When the underlying values of the securities owned by an MLP CEF structured as a C-corporation grows, the DTLs grow and the NAV rises more slowly (because DTLs are subtracted from net assets). This could hypothetically lead to a CEF with large embedded DTLs underperforming a CEF with small or no embedded DTLs despite the underlying holdings rising by the same amount.
Conversely, as the values of the underlying holdings fall, the shrinking DTLs act as a sort of cushion for the falling NAV as the liabilities are falling along with the assets, thereby causing the fund's overall NAV to drop less. For a more detailed discussion of DTLs, read this article.
In practice, before the severe drop-off in oil prices that began in 2014, many of the older MLP CEFs had fairly large DTLs, while some of the more recently launched funds had no or smaller DTLs. This has caused some performance discrepancies in the past year and a half as the recent slide has all but wiped out the majority of DTLs embedded in MLP CEFs.
Leverage Not surprisingly, the average MLP CEF has underperformed its average open-end peer during the past year and a half; much of this has to do with the use of leverage. It's important to understand that the closed structure of a CEF means managers aren't beholden to investor flows (that is, selling securities into a depressed market as investors panic and sell shares), which can be helpful to avoid locking in losses. That said, because the recent onslaught has been so prolonged, that benefit has been lost: Some of these funds have been forced to deleverage as they've bumped up against SEC regulations regarding leverage amounts. Though it may not be evident by simply looking at leverage ratios (total assets/net assets or total leverage/total assets) over time, many funds have been forced to redeem leverage in the past few months.
Backing up a bit, leverage is typically issued at a set dollar amount (say, $100 million in auction-rate preferred shares), so when the NAV falls and the dollar amount of leverage remains the same, funds may be in violation of leverage regulations and forced to redeem some of that outstanding leverage. In order to redeem leverage, the fund has to sell underlying assets. CEFs are built to avoid selling assets into a declining market, but in unusual circumstances like this (or 2008), it's often unavoidable.
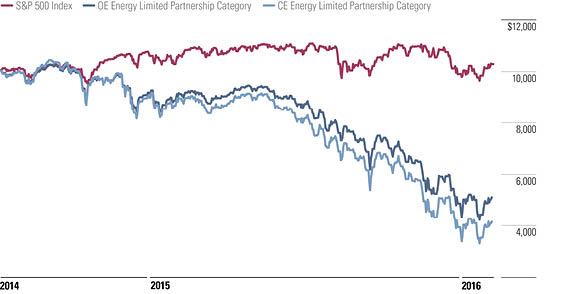
Though difficult to measure, investors should not lose sight of the negative impact these actions may have on both long- and short-term performance. To hammer this point home, Exhibit 2 shows the growth of $10,000 for the CEF and open-end MLP fund Morningstar Categories and the S&P 500. While both categories have suffered severe losses compared with the S&P 500 since mid-2014 (when oil prices began their descent), the CEF category has dropped off more precipitously.
Lower Prices but No Real Bargains We often talk about a fund's valuation and use a z-statistic to measure whether a fund is "cheap" or "expensive." As background, the z-statistic measures how many standard deviations a fund's discount/premium is from its three-year average discount/premium. For instance, a fund with a z-statistic of negative 2 would be two standard deviations below its three-year average discount/premium. Funds with the lowest z-statistics are classified as relatively inexpensive, while those with the highest z-statistics are relatively expensive. We consider funds with a z-statistic of negative 2 or lower to be "statistically undervalued" and those with a z-statistic of 2 or higher to be "statistically overvalued."
Exhibit 3 lists each of the MLP CEFs with discount, z-statistic, and distribution data as of March 2.

Despite the drop-off in share price of the MLP CEFs, NAVs have declined similarly, leading to only small changes in the funds' discounts over time. Some of the funds are even selling at premiums, despite losing a third or more of NAV in recent months. Because of this, no MLP CEF meets the criteria of being "cheap" or "statistically undervalued" during the trailing six-month or one- and three-year periods. In fact, a number of MLP CEFs look expensive: Take First Trust Energy Income & Growth FEN, which has a six-month z-statistic of 3.6, a one-year z-statistic of 3.8, and a three-year z-statistic of 2 as of March 2. As mentioned above, this is one of the better-performing MLP CEFs largely thanks to its holdings in non-MLPs.
Distributions Shrinking
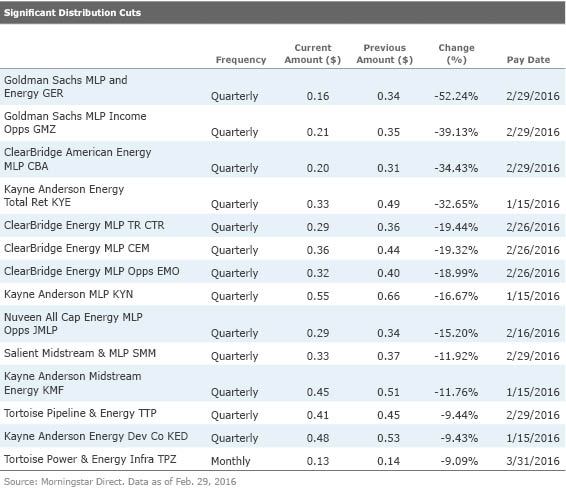
Net assets and share prices are not the only part of the MLP CEF structure that's been shrinking along with oil prices. From December through the end of February, 14 of the 26 CEFs in the energy limited partnership category announced distribution cuts. The cuts are a direct reflection of what's happening to the underlying securities as a result of lower for longer oil prices. In December,
Investors may be wondering whether now is the time to jump into MLP CEFs given the slight bounceback in February. This is not an easy question to answer as it depends solely on an investor's investment objectives. For opportunistic investors, perhaps it is time, although valuation measures don't look particularly enticing. Long-term investors looking to add energy exposure to their portfolios may find the lower prices (and relatively high distribution rates at share price) intriguing but should be aware that more distribution cuts are likely in the future, which could dampen medium- to long-term total return prospects. The storm is not likely to end soon, and any investor needs to be aware of the potential negatives (volatility, forced deleveraging, distribution cuts) before purchasing shares.
/cloudfront-us-east-1.images.arcpublishing.com/morningstar/OMVK3XQEVFDRHGPHSQPIBDENQE.jpg)
/cloudfront-us-east-1.images.arcpublishing.com/morningstar/AGAGH4NDF5FCRKXQANXPYS6TBQ.png)
:quality(80)/s3.amazonaws.com/arc-authors/morningstar/af89071a-fa91-434d-a760-d1277f0432b6.jpg)