
9 Charts on What’s Happening With the Market
This month: the small-cap rotation, looming Fed-rate cuts, and cash on the move.

Small-Cap Rotation
One reason to own asset classes others ignore is because it often takes little positive news for the tides to turn.
Small caps are one such example. Large pools of investor money have mostly been ignoring small caps.
There are valid reasons: underperformance versus large caps being the most obvious. Pain from rising rates (small caps hold more floating-rate debt, which becomes more expensive as rates rise) has been a significant factor driving that. We’ve mentioned previously that small caps can be characterized by The Three U’s: unloved, underperforming, and undervalued.
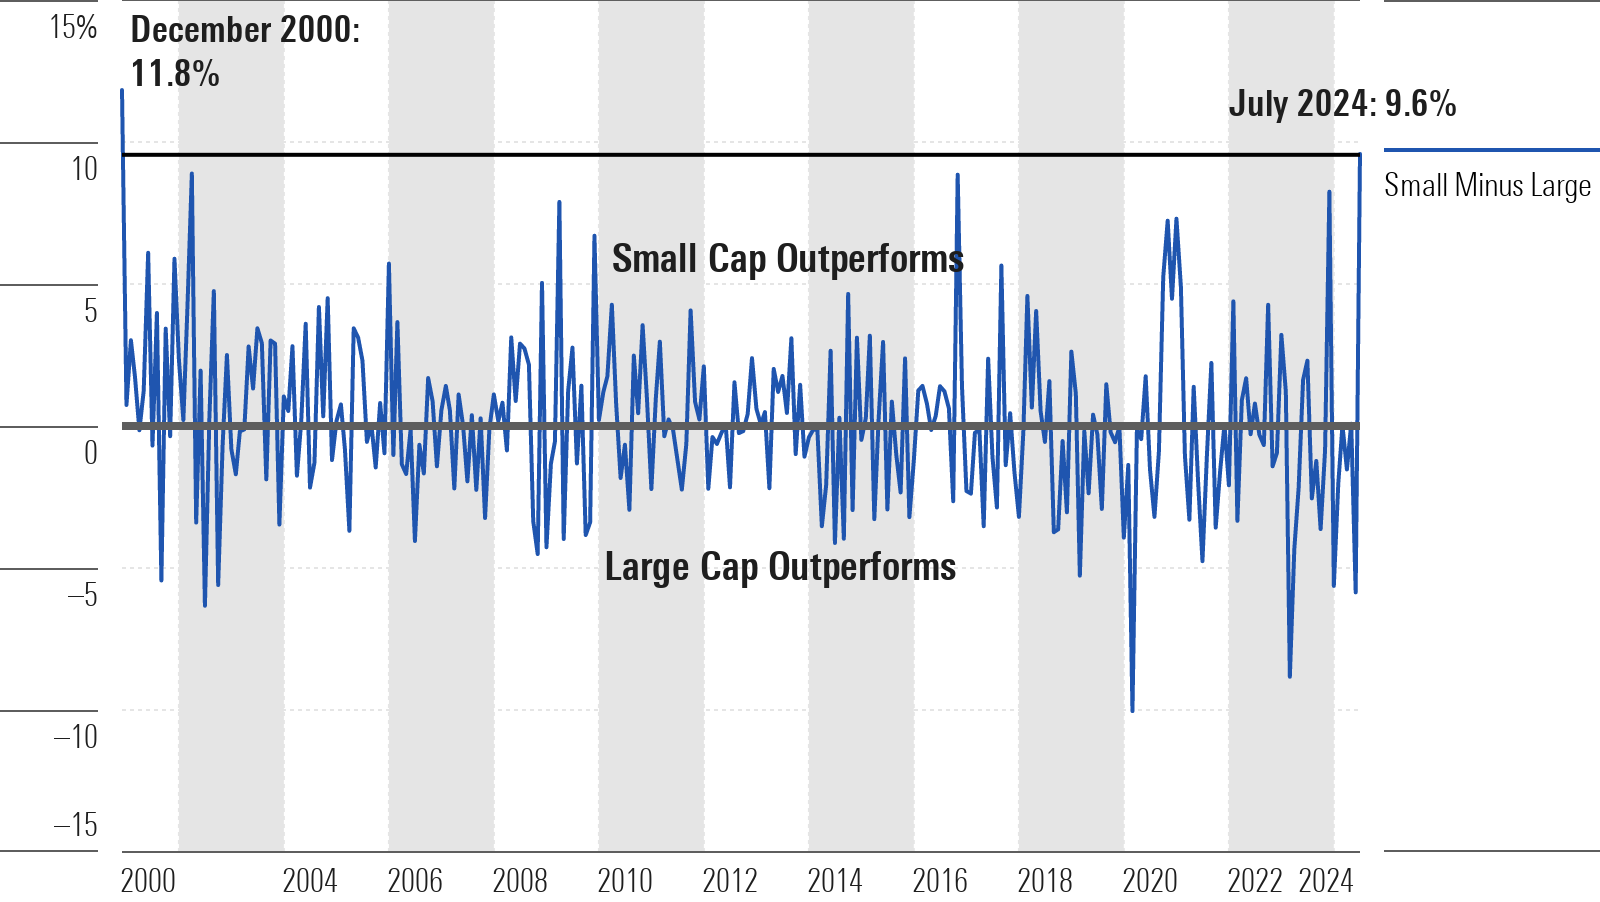
From July 10 through July 31, small caps returned more than 12%, per Morningstar data. Such a return would be impressive for an entire year, let alone a few weeks. As they say, there are weeks when years happen, and that’s what took place in the middle of July. Small caps outperformed large caps by around 10% for the month, which was the single largest month of outperformance since December 2000.
Small Cap Minus Large Cap (Monthly Returns)
Meanwhile, large caps have been experiencing something they haven’t in a while—a drawdown.
The tech-heavy Nasdaq had a peak-to-trough decline of 9% in July, while the S&P 500 experienced a 5% decline. Additionally, on July 24, the S&P 500 saw its first trading day with a loss of more than 2% in nearly 18 months. One trading day means nothing over an investing lifetime, but lifting the hood on that day paints a sobering picture.
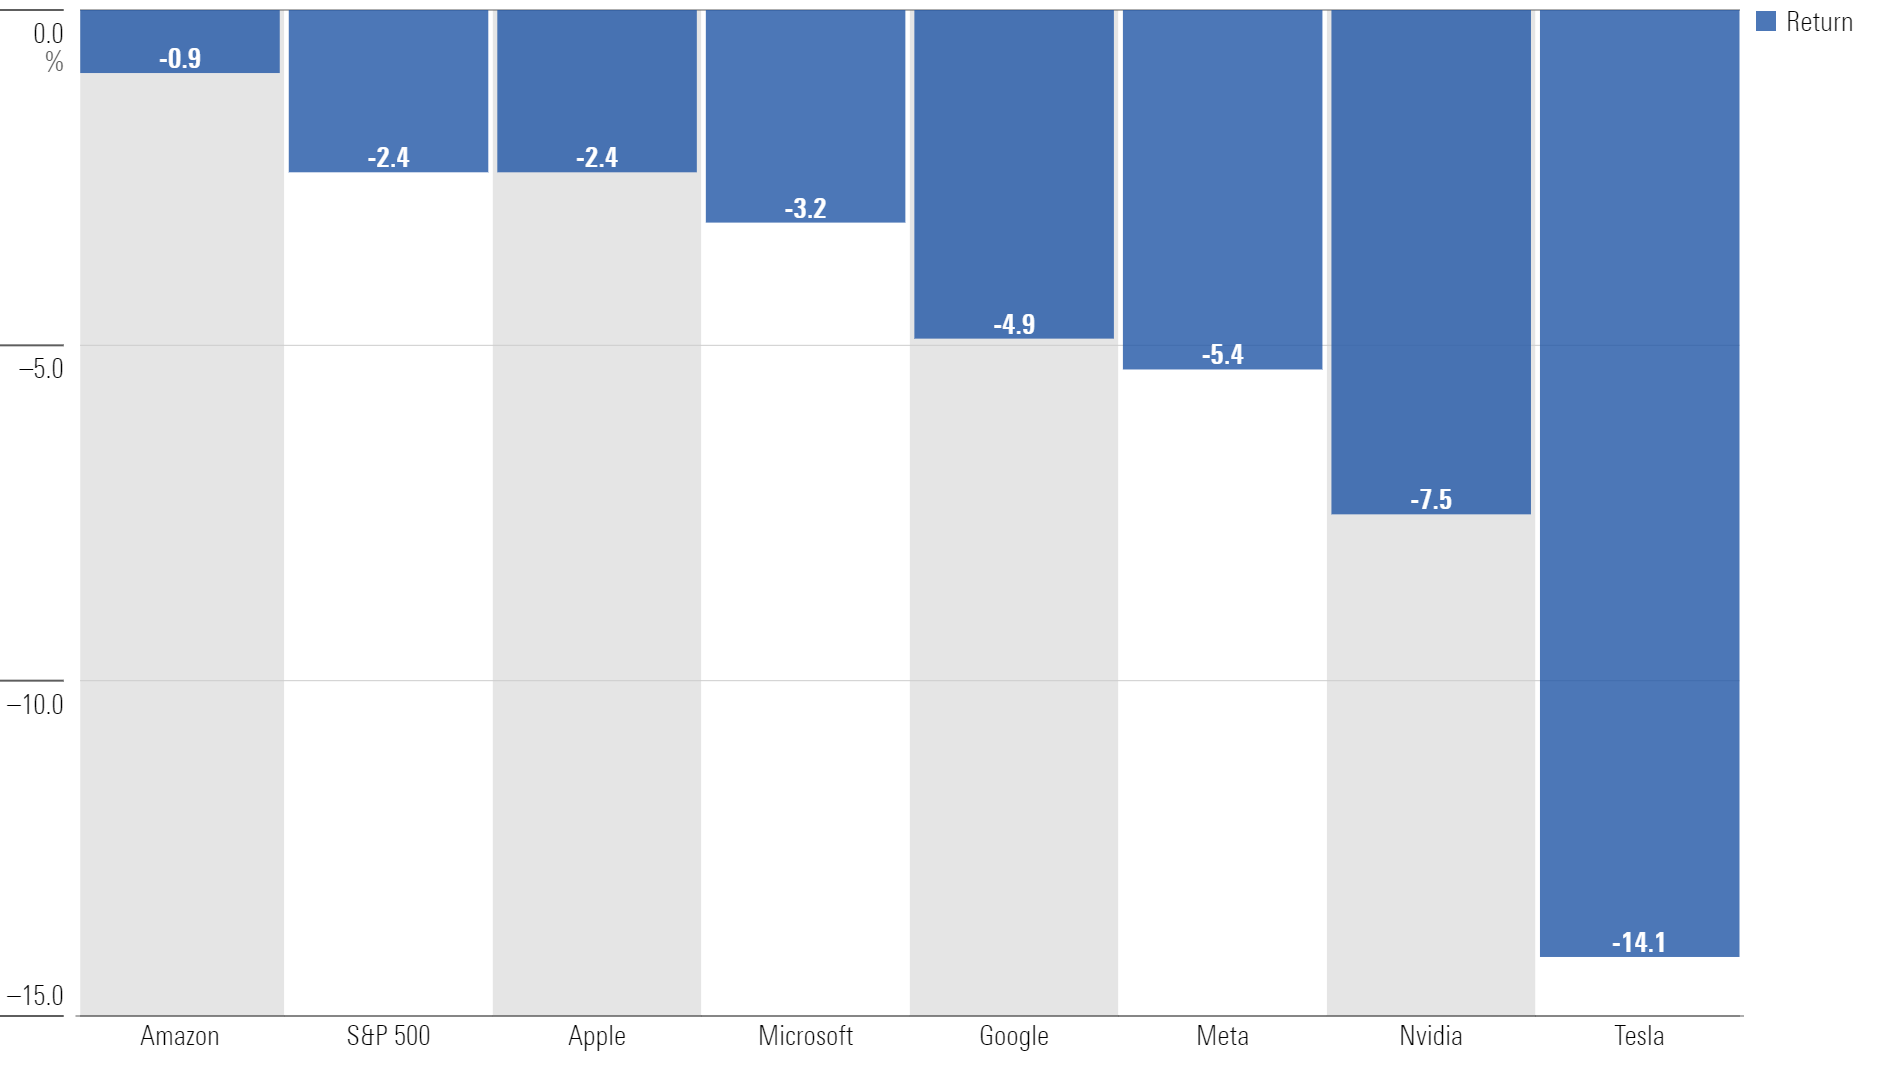
Four of the “Magnificent Seven” companies declined by 5% or more on that day.
Returns on July 24
Printers have run out of ink in discussing how much of the market’s strong performance has been driven by the Magnificent Seven. But the same is true on the downside. Nvidia had a peak-to-tough drawdown of 23% over 14 trading days in July.
Nvidia Share Price Drawdown
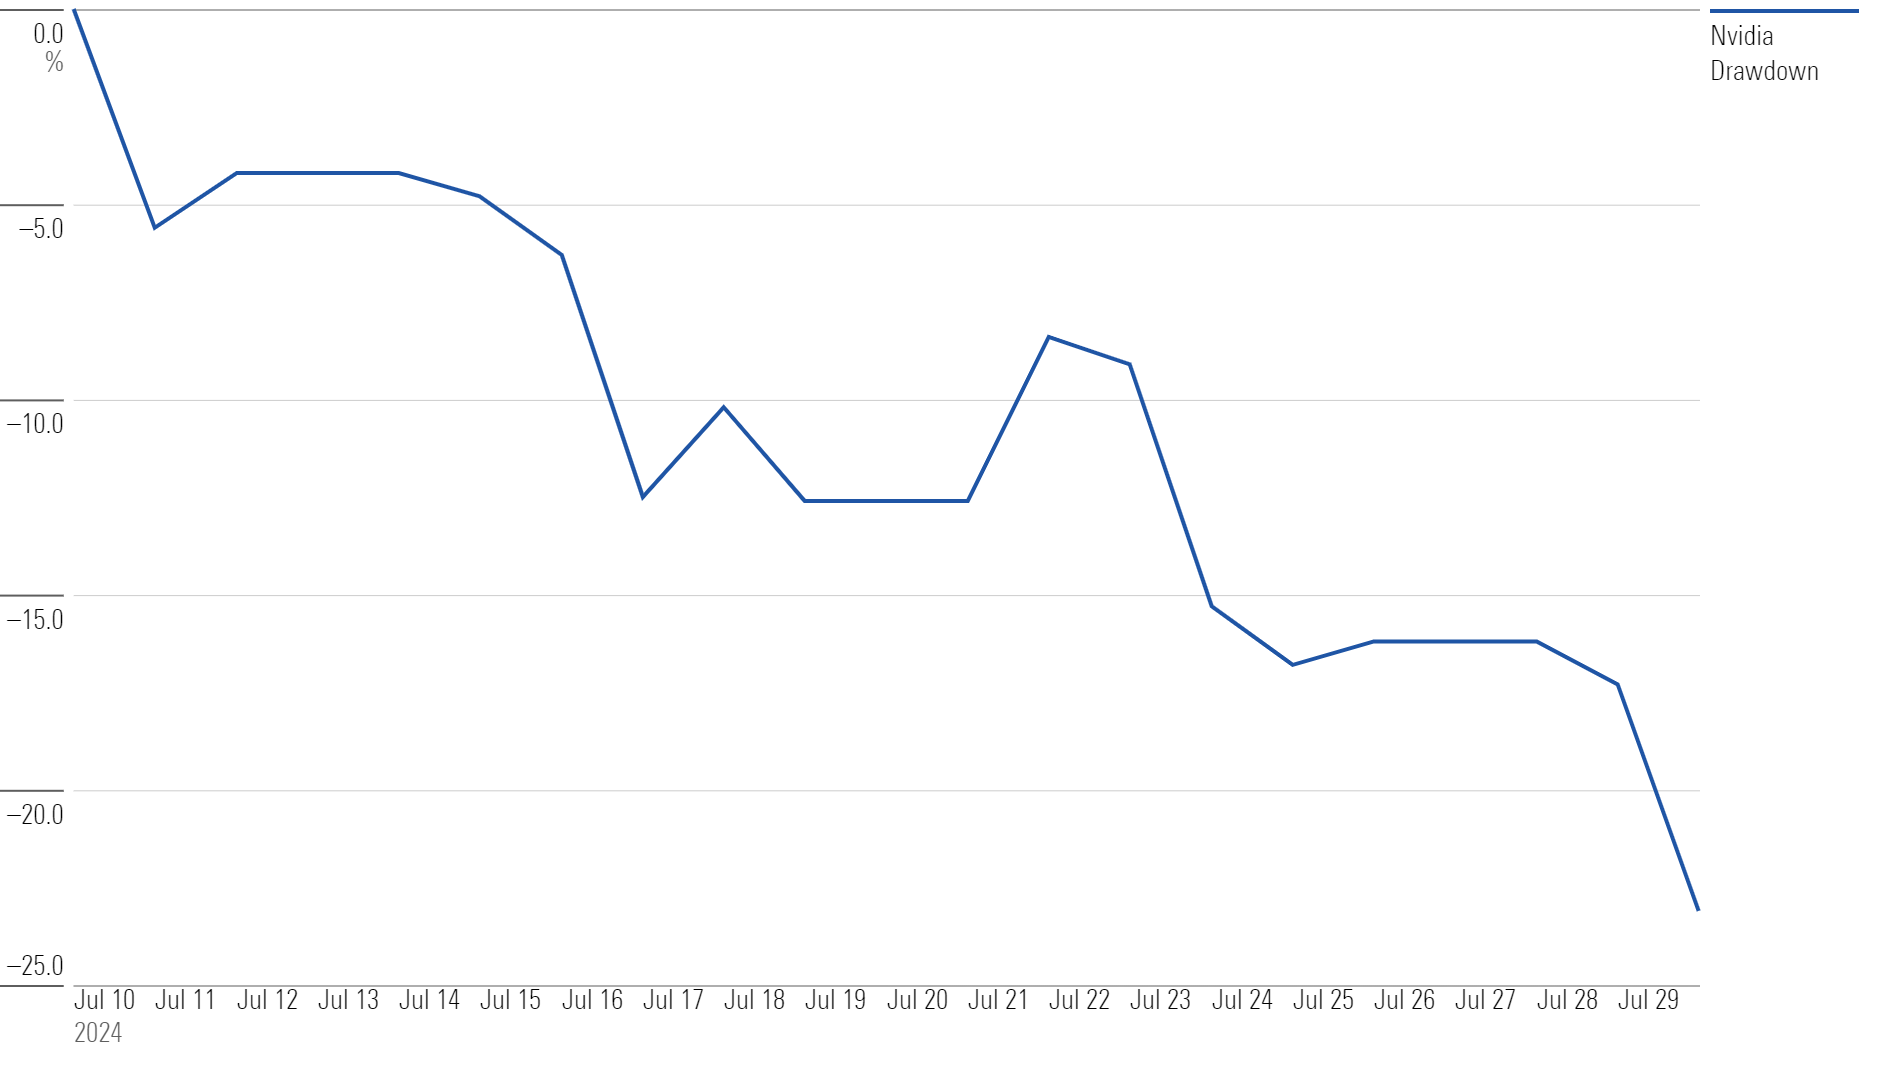
Of course, anyone would happily accept that decline in Nvidia for the returns that preceded it. Even after this drawdown, Nvidia shares remain up over 100% for the year.
But the point remains, risk happens fast, and that’s why diversification is critical. And while it’s nice to see the benefits of diversification working through small caps, nobody deserves a parade for a few strong weeks of performance.
The question now becomes: Have small caps run too far, too fast? While unsatisfying, the answer would be: It depends.
If you’re a day trader, maybe it has. An asset class that went up 12% in a month probably isn’t the best bet if you’re looking to earn another 12% next month. But if you’re an investor who allocates based on probabilities and market history, there are reasons to believe this rally might have a pair of running shoes on.
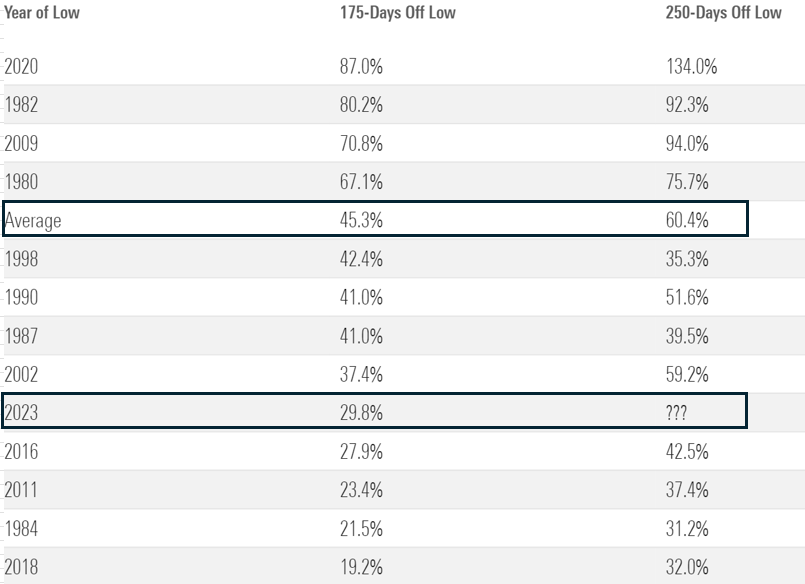
For example, small caps are now up around 30% since their October 2023 low.
Looking at other major cycle lows in small-cap history, the average move higher 175 days later has been around 45%. And if you stretch the time horizon to 250 days, the average move higher has been approximately 60%.
Small-Cap Performance After Cycle Lows
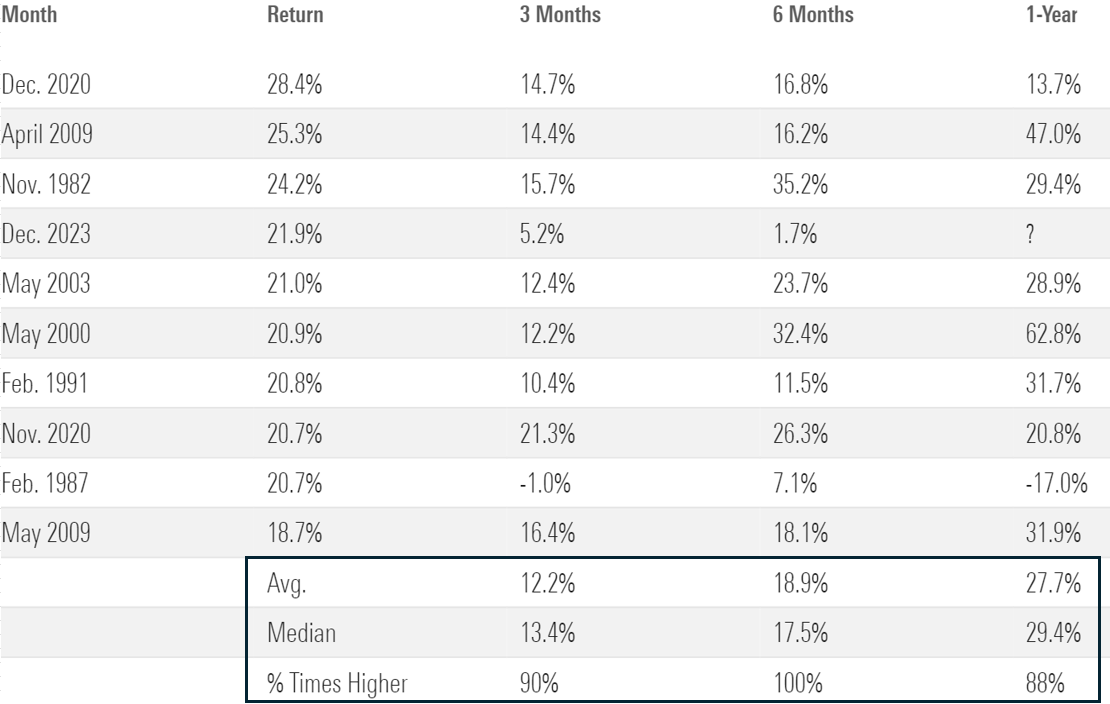
Furthermore, using data from Carson Group, they identified the 10 best two-month periods for small caps ever and examined the subsequent returns. One year later, small caps were higher eight out of nine times, with an average increase of nearly 28%.
Small-Cap Performance After Strong Two-Month Periods
Put simply, it’s possible that July was the start of something, rather than a unique one-time event.
Markets Price In Fed Rate Cuts
What was responsible for this market rotation? As always, changing expectations about the future.
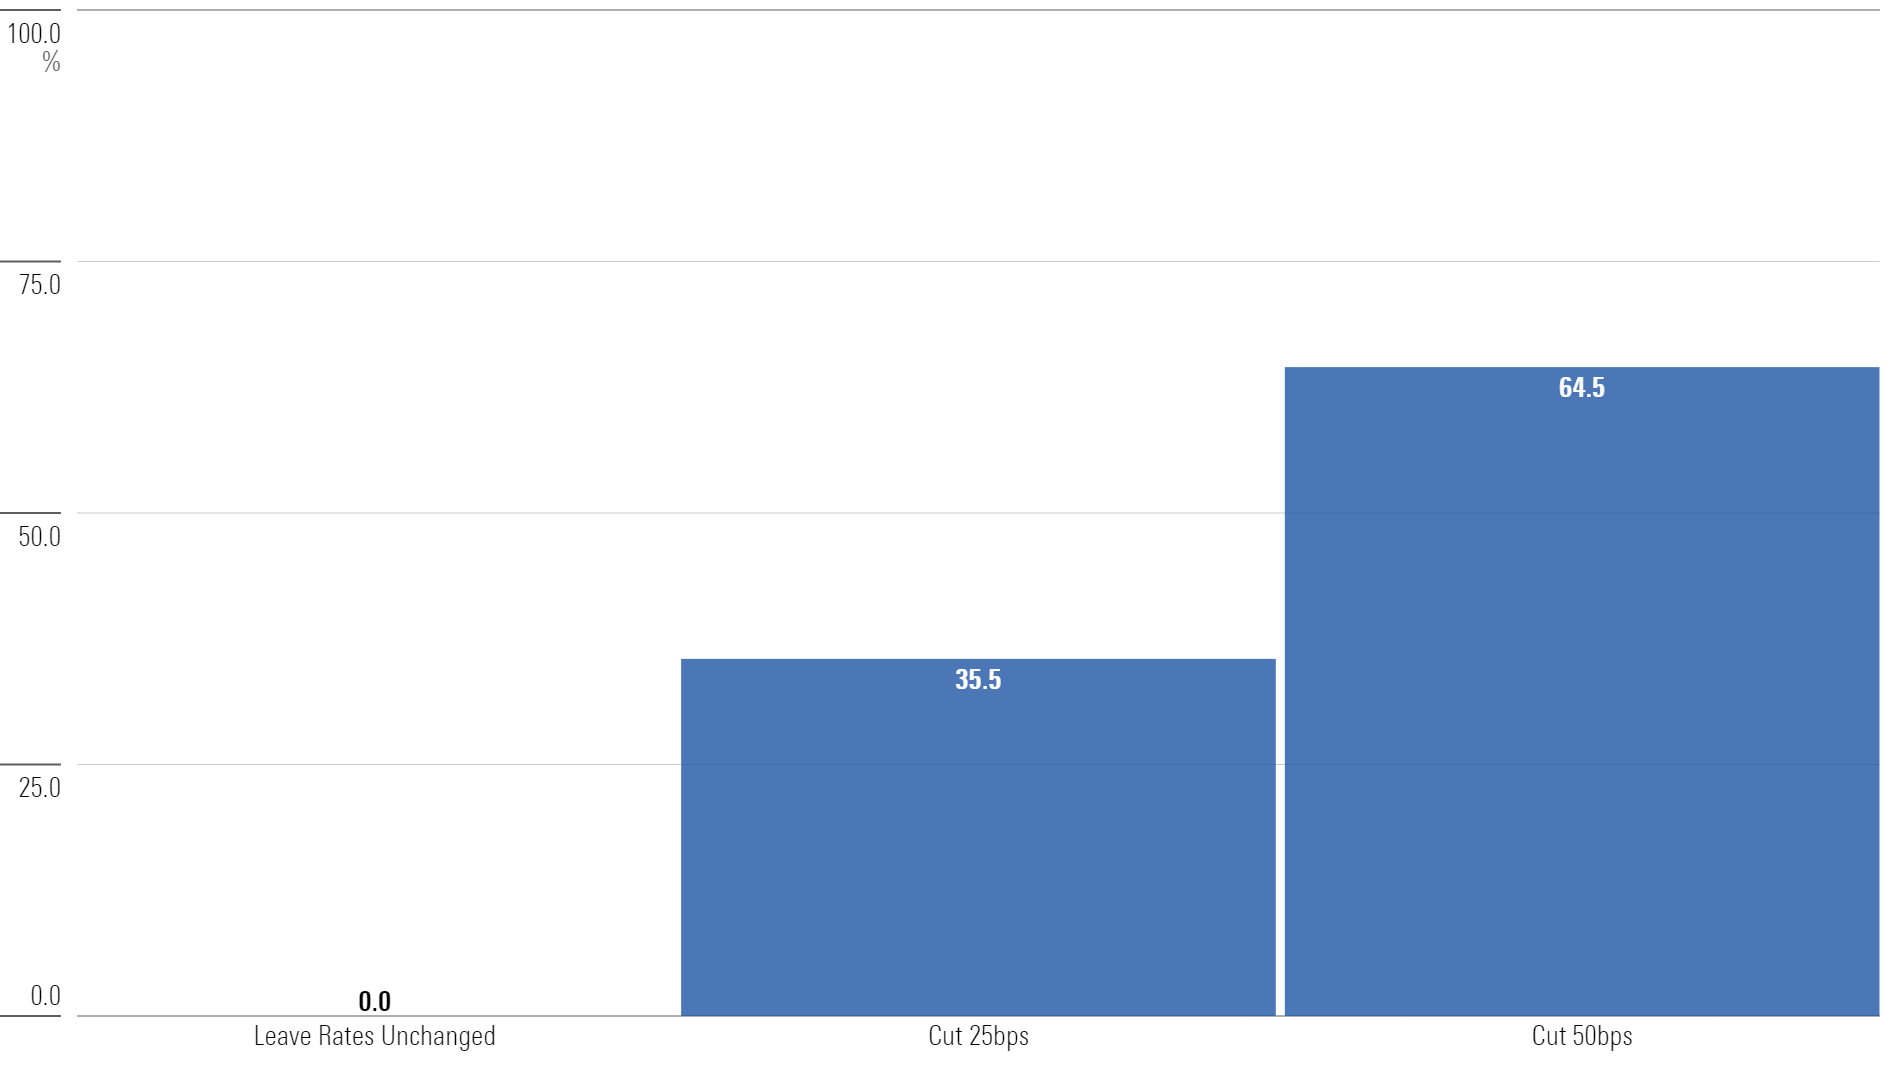
The market finally sees Fed rate cuts in sight. Using data from CME Group, the futures market is pricing in the first Fed rate cut in September with near certainty.
September Fed Meeting - Rate Probabilities
Furthermore, the futures market now estimates that four 25-basis-point rate cuts by the end of this year are the most likely outcome.
Year-End Rate Probabilities
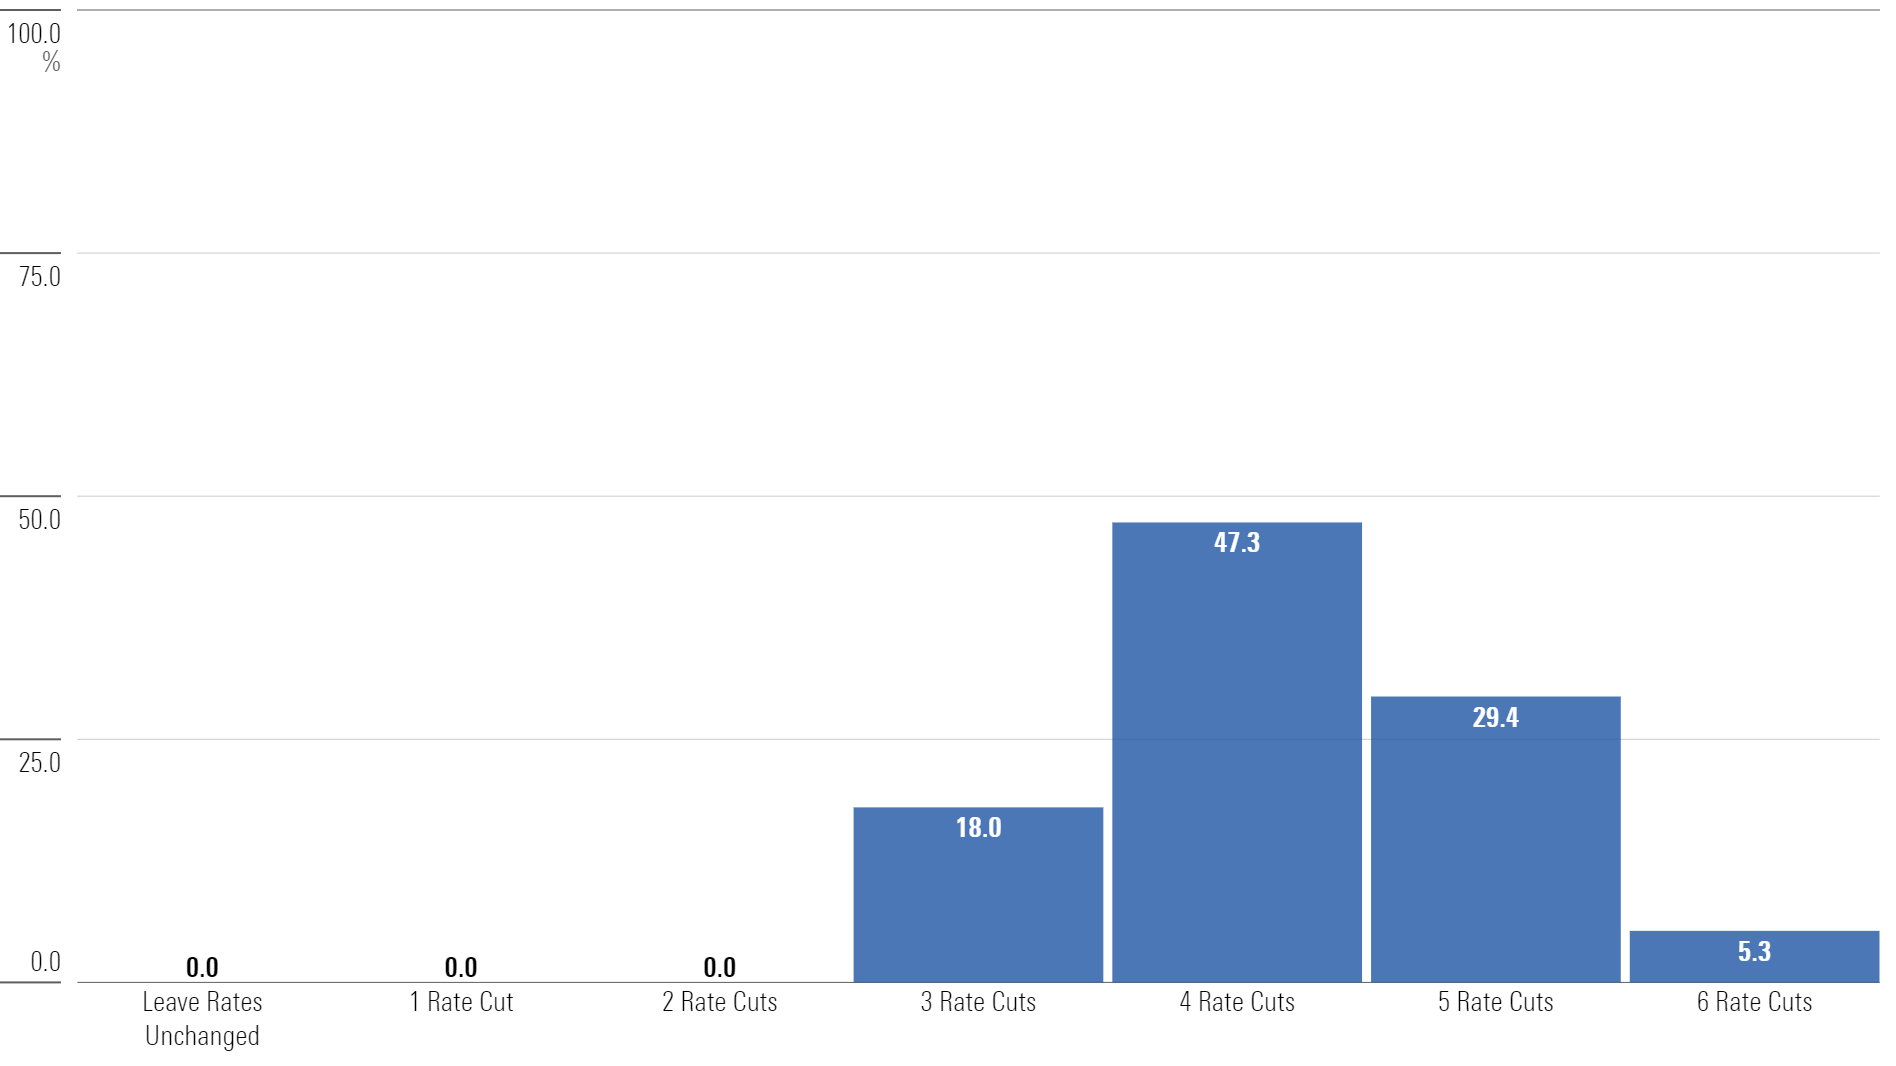
There are no guarantees this will happen. These odds move around quickly as new data gets released, but these numbers represent a wholesale change in expectations. Only a few months ago, the market was estimating one rate cut, and now it believes four might be possible.
The market responded quickly to reflect this new information. This is what markets do: They adjust prices rapidly as expectations change. They don’t wait for the Fed to announce a rate cut in September; they reflect it in prices well ahead of time.
And while markets move quickly, the average investor may not. One area of interest is how investors might react if yields on cash fall because of potential rate cuts.
Cash on the Move?
A few large stocks driving the market’s return has arguably been the most discussed topic across markets. But one topic potentially as important could be the impact of rate cuts on cash.
Why? Record amounts of money have poured into money market funds. Last year was the highest ever for money market fund flows. Using data from the Federal Reserve, more than $6.4 trillion currently resides in money market funds, an all-time high.
Money Market Funds: Total Assets
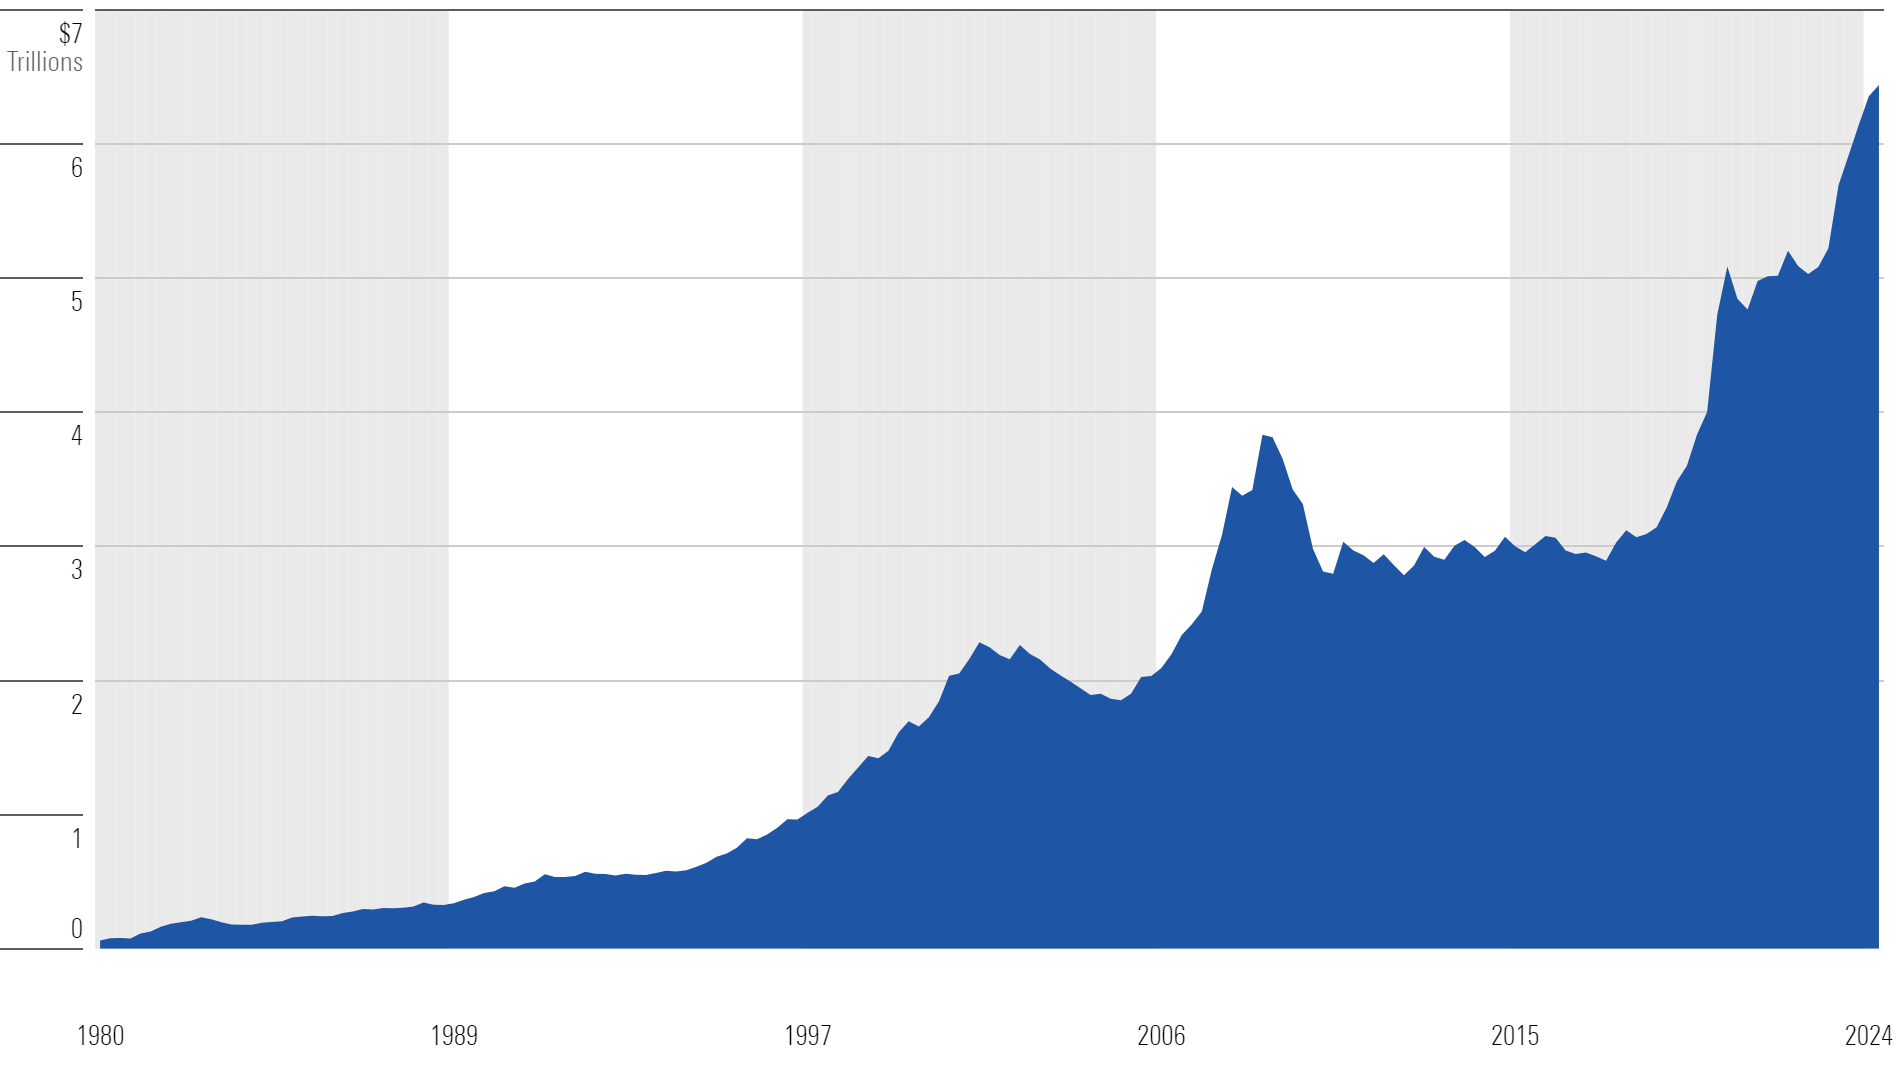
Investors who had been starved of yield for a decade prior to the past few years have eagerly jumped at the newfound yield.
But when the Fed cuts rates, history shows money market rates drop in tandem. You can see the relationship between the fed-funds rate and three-month CDs over the past 60 years.
Fed-Funds Rate and Cash Yields
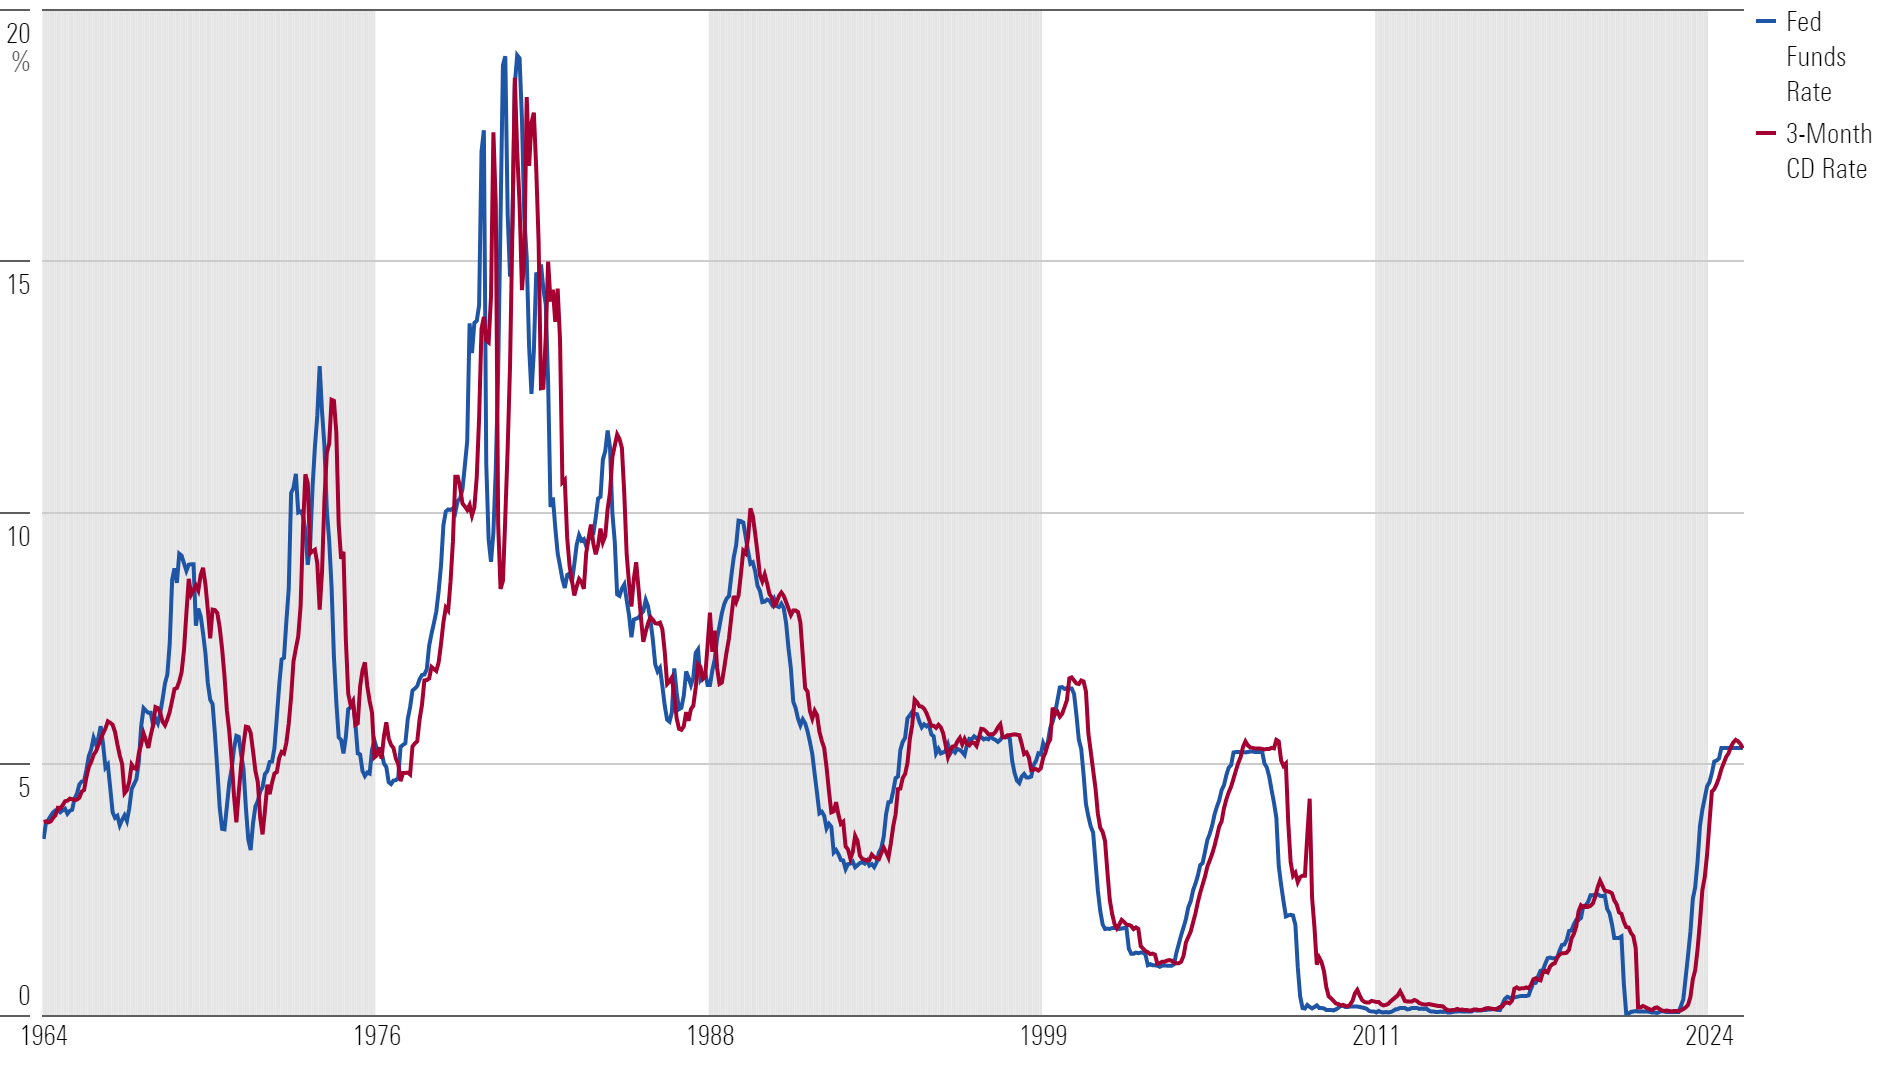
They basically hug each other. Investors holding excess cash should be thinking critically about this. If you’re holding cash for a near-term event, a home purchase for example, then nothing should change. However, if you were planning to get out of cash, it might be time to stop planning and take action.
On a recent investor call, BlackRock CEO Larry Fink shared trends they’re observing in investor behavior, mentioning:
“More investors are starting to re-risk. Investors waiting in cash have missed out on big returns over the past year.”
This is not a new phenomenon. Cash feels comfortable, but it’s rarely the safe haven we perceive it to be when you consider what happens over long time periods. The long-term outcomes many investors hope to achieve likely requires more than the 5% return that money market funds currently offer. Investors will have to re-risk, which could improve flows into equity markets and serve as a future catalyst that supports equities.
This article is a condensed version of The Market Minute from Morningstar Wealth. If interested, a full slide deck of these charts can be accessed here.
The author or authors do not own shares in any securities mentioned in this article. Find out about Morningstar’s editorial policies.
Morningstar Investment Management LLC is a Registered Investment Advisor and subsidiary of Morningstar, Inc. The Morningstar name and logo are registered marks of Morningstar, Inc. Opinions expressed are as of the date indicated; such opinions are subject to change without notice. Morningstar Investment Management and its affiliates shall not be responsible for any trading decisions, damages, or other losses resulting from, or related to, the information, data, analyses or opinions or their use. This commentary is for informational purposes only. The information data, analyses, and opinions presented herein do not constitute investment advice, are provided solely for informational purposes and therefore are not an offer to buy or sell a security. Before making any investment decision, please consider consulting a financial or tax professional regarding your unique situation.
/cloudfront-us-east-1.images.arcpublishing.com/morningstar/A5UY22L42ZASPAW6OW75IQHR2U.png)
/cloudfront-us-east-1.images.arcpublishing.com/morningstar/GQNJPRNPINBIJGIQBSKECS3VNQ.jpg)
/cloudfront-us-east-1.images.arcpublishing.com/morningstar/SRXFRUTTFZGPPK6U6Y5EG4WGMY.png)