
Can Renewables Overtake Natural Gas in Power Generation?
Renewable energy has policy momentum, but gas generation offers reliability.
/s3.amazonaws.com/arc-authors/morningstar/ea0fcfae-4dcd-4aff-b606-7b0799c93519.jpg)
/s3.amazonaws.com/arc-authors/morningstar/20ab29d0-a934-4b10-b861-770e63c08853.jpg)
We are reaffirming our fair value estimates and moat ratings for all U.S. utilities after updating our 2020-30 U.S. power generation forecast. Our forecast shows natural gas generation expanding its leading share in the U.S. power generation market through 2030. But our forecast also shows renewable energy moving into second place, overtaking coal, nuclear, and hydropower generation.
We think this sets up a battle for market share by the end of the next decade: natural gas versus renewable energy. Renewable energy has policy momentum, and its costs are now competitive with natural gas generation even at today’s low gas prices and without tax subsidies. But gas generators offer grid reliability, a key competitive advantage.
We forecast U.S. renewable energy will top 1,000 terawatt-hours by 2030, or 22% of U.S. electricity generation, excluding hydropower. We think the ramp-down in solar and wind tax credits during the next five years won’t slow growth as much as others assume. Our 8% compound annual growth rate for 2018-30 is higher than global growth rate forecasts and higher than the most recent U.S. Energy Information Administration reference case. Utilities with large renewable energy investment plans like NextEra Energy NEE and Xcel Energy XEL will continue to benefit under our higher renewable energy growth forecast.
State renewable energy portfolio standards and corporate purchases should fill in any growth gaps related to tax roll-offs. We estimate that 32 of the 38 states with renewable energy targets have not met their marks. New York (70% by 2030) and California (60% by 2030) represent one third of our renewable energy growth forecast.
We forecast natural gas generation will grow 2% annually between 2019 and 2030, reaching 41% of U.S. generation. Coal and nuclear each fall to 15% market share in our forecast.
Solar Growth Underestimated Solar is the key disrupter, and experts have consistently underestimated it. A 2012 government industry report suggested solar would struggle to reach 50 gigawatts and 11% of U.S. electricity demand by 2030. However, solar already has 40 GW operating and 37.9 GW in construction or backed with signed contracts. Module shipments are exceeding 1 GW per month. With some 200 GW in U.S. grid operators' interconnection queues, solar could become the second-largest generation source behind natural gas in the next decade. Solar's load-matching profile makes it the biggest threat to natural gas. In California, gas demand for power generation has fallen 30% since 2015, and the state's zero-carbon target could mean eliminating all gas use by 2045. The next big tests will be in Florida and Texas, where gas generation dominates but solar has momentum.
Wind Growth Overestimated Wind growth estimates are too high, in our view. In 2009, the North American electric grid monitor forecast 145 GW of wind energy in 2019, far above the 99 GW now in service. In 2015, the U.S. Department of Energy forecast wind would hit 20% of U.S. electricity demand by 2030, well beyond what we think is possible. Wind bulls did not anticipate competing with natural gas or solar. Subsidized coal and nuclear generation is leveling off, and solar is stealing on-peak market share. That means wind is starting to fight gas for off-peak market share. Gas has the reliability advantage; wind has the cost advantage. This war has whacked off-peak power prices in Texas, spurred offshore wind in the land-constrained, gas-short Northeast, and led utilities to flip-flop investment between gas and wind. We expect cheap gas and reliability will vault gas to more than 40% of U.S. generation by 2030. However, wind growth could surge with cost-effective energy storage. We think offshore wind will be a financial, regulatory, and logistical albatross for early entrants.
Policy Sets Floor for Renewable Energy Growth We estimate renewable energy will have to more than double by 2030 just to meet current renewable portfolio standard, or RPS, targets in 38 states and Washington, D.C. This represents more than three fourths of our 10-year growth forecast after incorporating our state demand forecasts. We estimate 32 states have not met their RPS. New York (70% by 2030) and California (60% by 2030) represent one third of our RPS-based renewable energy growth estimate during the next decade. Michigan, New Jersey, Illinois, and Pennsylvania also require big investments. Six states--Maine (2050), California (2045), Hawaii (2045), New Mexico (2045-50), Nevada (2045), Washington (2045)--and Washington, D.C. (2032) are on quests to reach 100% RPS. We believe the renewable energy policy floor will keep rising.
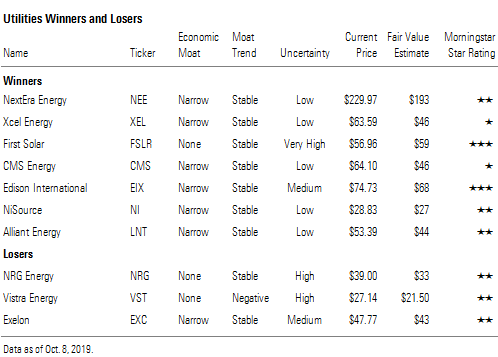
Utilities Winners and Losers
/cloudfront-us-east-1.images.arcpublishing.com/morningstar/LE5DFBLC5VACTMC7JWTRIYVU5M.jpg)
/cloudfront-us-east-1.images.arcpublishing.com/morningstar/PJQ2TFVCOFACVODYK7FJ2Q3J2U.png)
/cloudfront-us-east-1.images.arcpublishing.com/morningstar/KPHQX3TJC5FC7OEC653JZXLIVY.jpg)
:quality(80)/s3.amazonaws.com/arc-authors/morningstar/ea0fcfae-4dcd-4aff-b606-7b0799c93519.jpg)
:quality(80)/s3.amazonaws.com/arc-authors/morningstar/20ab29d0-a934-4b10-b861-770e63c08853.jpg)