
Markets Brief: Inflation Back on the Agenda
Plus: Tech weakness, yield curves, Mr. Market, and rate cut forecasts.
/s3.amazonaws.com/arc-authors/morningstar/687c42c2-15b8-4c8d-a9f6-6fadac96dd73.jpg)

Insights into key market performance and economic trends from Dan Kemp, Morningstar’s global chief research and investment officer.
Technology Sector Underperforms
Pessimism engulfed investors again last week as the Morningstar US Market Index fell 4.3%, wiping out August’s gains. Companies within sectors traditionally most aligned with the health of the US economy saw the greatest falls, such as basic materials (-3.1%), consumer cyclicals (-2.8%), energy (-4.4%), and industrials (-4.9%).
Technology also fell sharply (-3.6%), dragged down by index heavyweights Apple AAPL (-3.9%), Nvidia NVDA (-12.5%), and Broadcom AVGO (-12.7%). Consequently, the technology sector has underperformed the broader US market over the last six months, and the valuation of the market has fallen a little below Morningstar analysts’ estimate of its fair value. For more details, check out Morningstar’s new Markets page.
Bond Yields No Longer Inverted
There was big news in the bond market last week. The relative yield on longer (10-year) and shorter (2-year) US Treasury bonds returned to normal, with the latter now yielding a little less (3.65%) than the former (3.71%). Economists closely watch this relationship, since an inversion has historically been the most reliable indicator of a forthcoming recession. The absence of a recession (so far) is a useful reminder of the difficulties of successfully forecasting a basic economic variable.
Beyond this lesson in humility, the reversion of this relationship is important. Most investment assets are valued relative to the Treasury yield, so this move hints at more normal capital market pricing. This would be a boon to those who use valuation as their guide. Dave Sekera, Morningstar’s chief US equity strategist, covers the valuation differences across the US in his latest market outlook.
Beware of Mr. Market
The proximate cause of last week’s pessimism appears to be Friday’s weaker-than-expected employment data. Decades ago, investing legend Ben Graham provided a useful way to understand price declines. He anthropomorphized the movements of stock prices with a character he called “Mr. Market.”
Graham likened Mr. Market to a hyperactive business partner willing to buy or sell his portion every day at a different price, depending on his mood. Since the real value of the business changes more slowly, Mr. Market is frequently willing to overpay or underpay. Unfortunately for investors, Mr. Market is very persuasive, and unless you’re careful, you might follow his lead and see your investment’s value diminish while the business continues growing. It’s generally safer to ignore Mr. Market’s daily offers and focus on the long-term health of the business.
Inflation Data and Rate Cut Expectations
Market commentators will likely return their attention to inflation this week, with Wednesday’s release of the latest Consumer Price Index data and producer price inflation data coming Thursday. The core measures, excluding food and energy prices, are expected to remain stable, with headline inflation continuing to fall. A significant deviation from this outcome is likely to cause some volatility, as traders attempt to incorporate this information into their expectations for interest rate cuts at the forthcoming Federal Reserve Open Market Committee meeting. You can see what’s happening this week on Morningstar’s new market calendar page.
Highlights of This Week’s Market and Investing Events
- Monday, Sept. 9: July Consumer Credit report, earnings from Oracle ORCL
- Wednesday, Sept. 11: August Consumer Price Index report
- Thursday, Sept. 12: Initial Unemployment Insurance Claims report, August Producer Price Index report, earnings from Adobe ADBE
- Friday, Sept. 13: September preliminary University of Michigan Index of Consumer Sentiment
Check out our full weekly calendar of economic reports, consensus forecasts, and corporate earnings.
For the Trading Week Ended Sept. 6
- The Morningstar US Market Index was down 4.35%.
- The best-performing sectors were consumer defensive, up 0.16%, and real estate, down 0.06%.
- The worst-performing sector was technology, down 6.82%.
- Yields on 10-year US Treasury notes fell to 3.72% from 3.91%.
- West Texas Intermediate crude prices fell 8.5% to $68.21 per barrel.
- Of the 704 US-listed companies covered by Morningstar, 115, or 16%, were up, and 589, or 84%, were down.
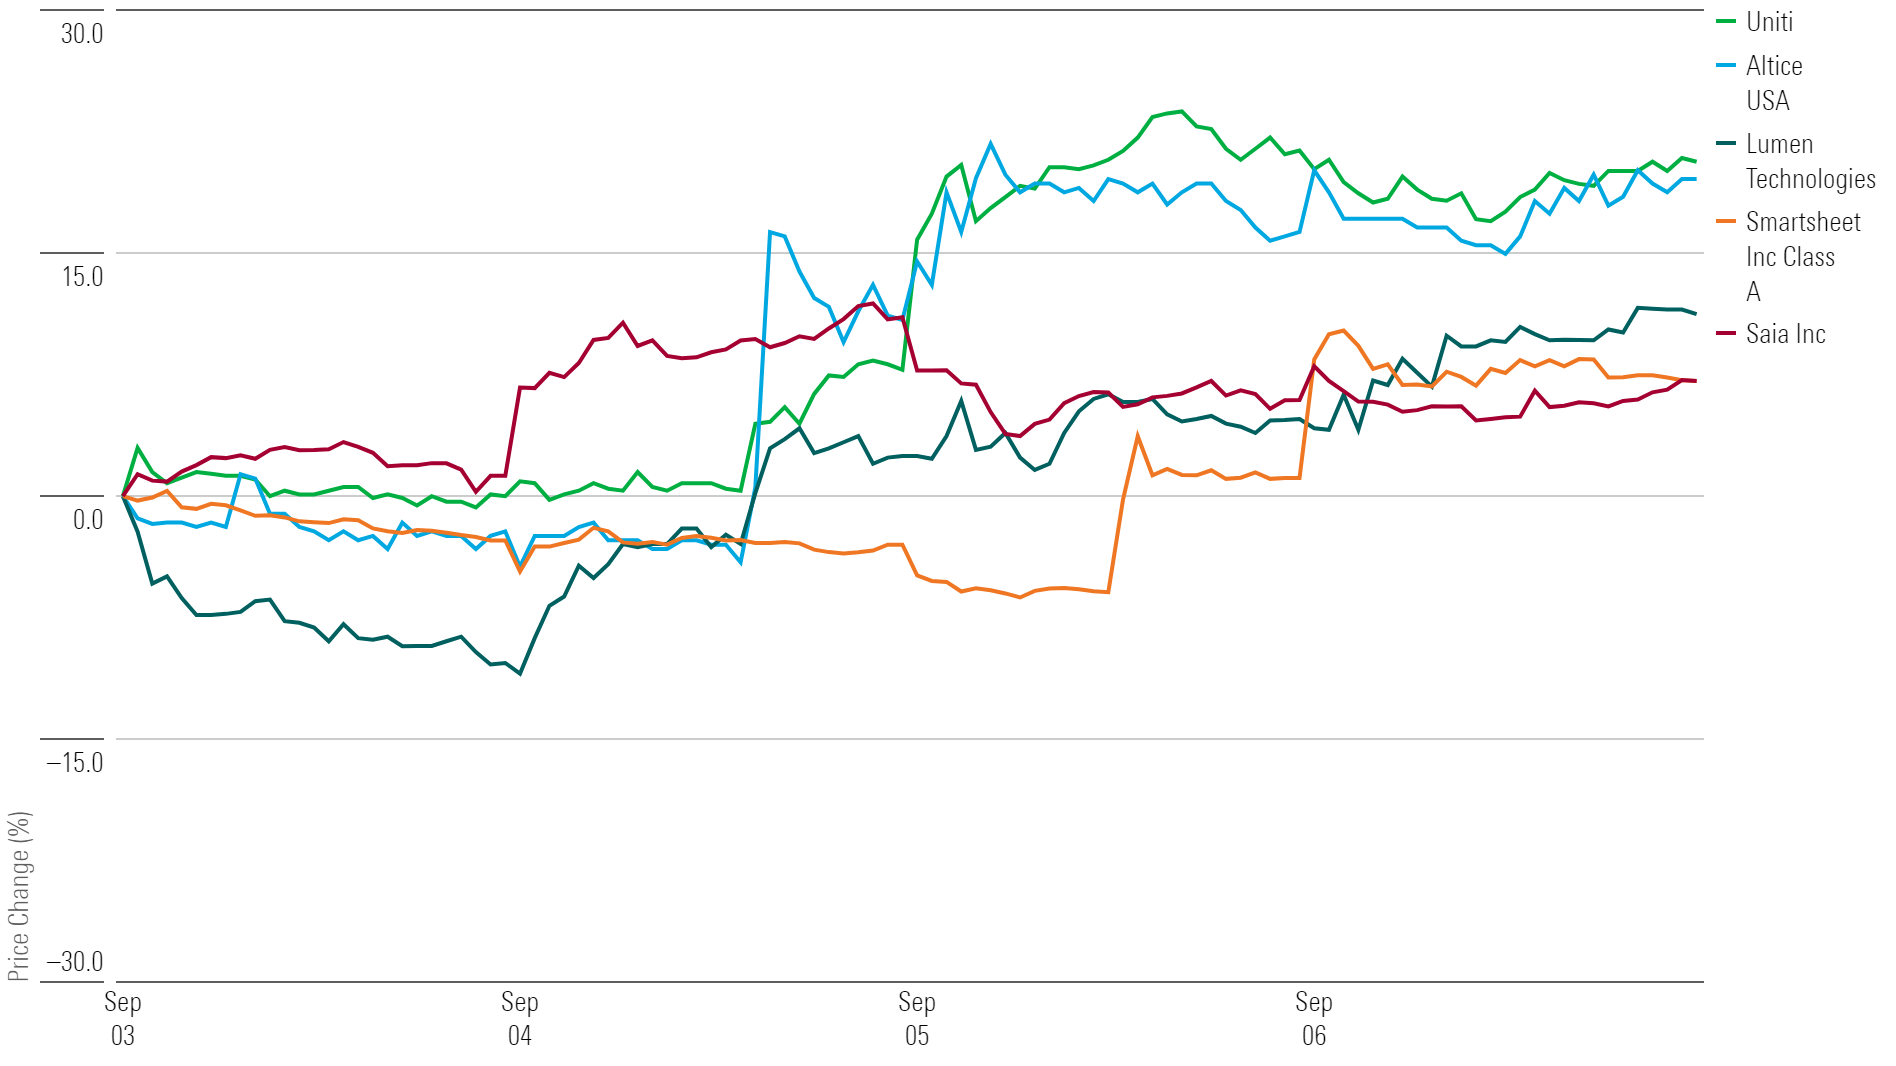
What Stocks Are Up?
Uniti Group UNIT, Altice USA ATUS, Lumen Technologies LUMN, Smartsheet SMAR, Saia SAIA
Best-Performing Stocks of the Week
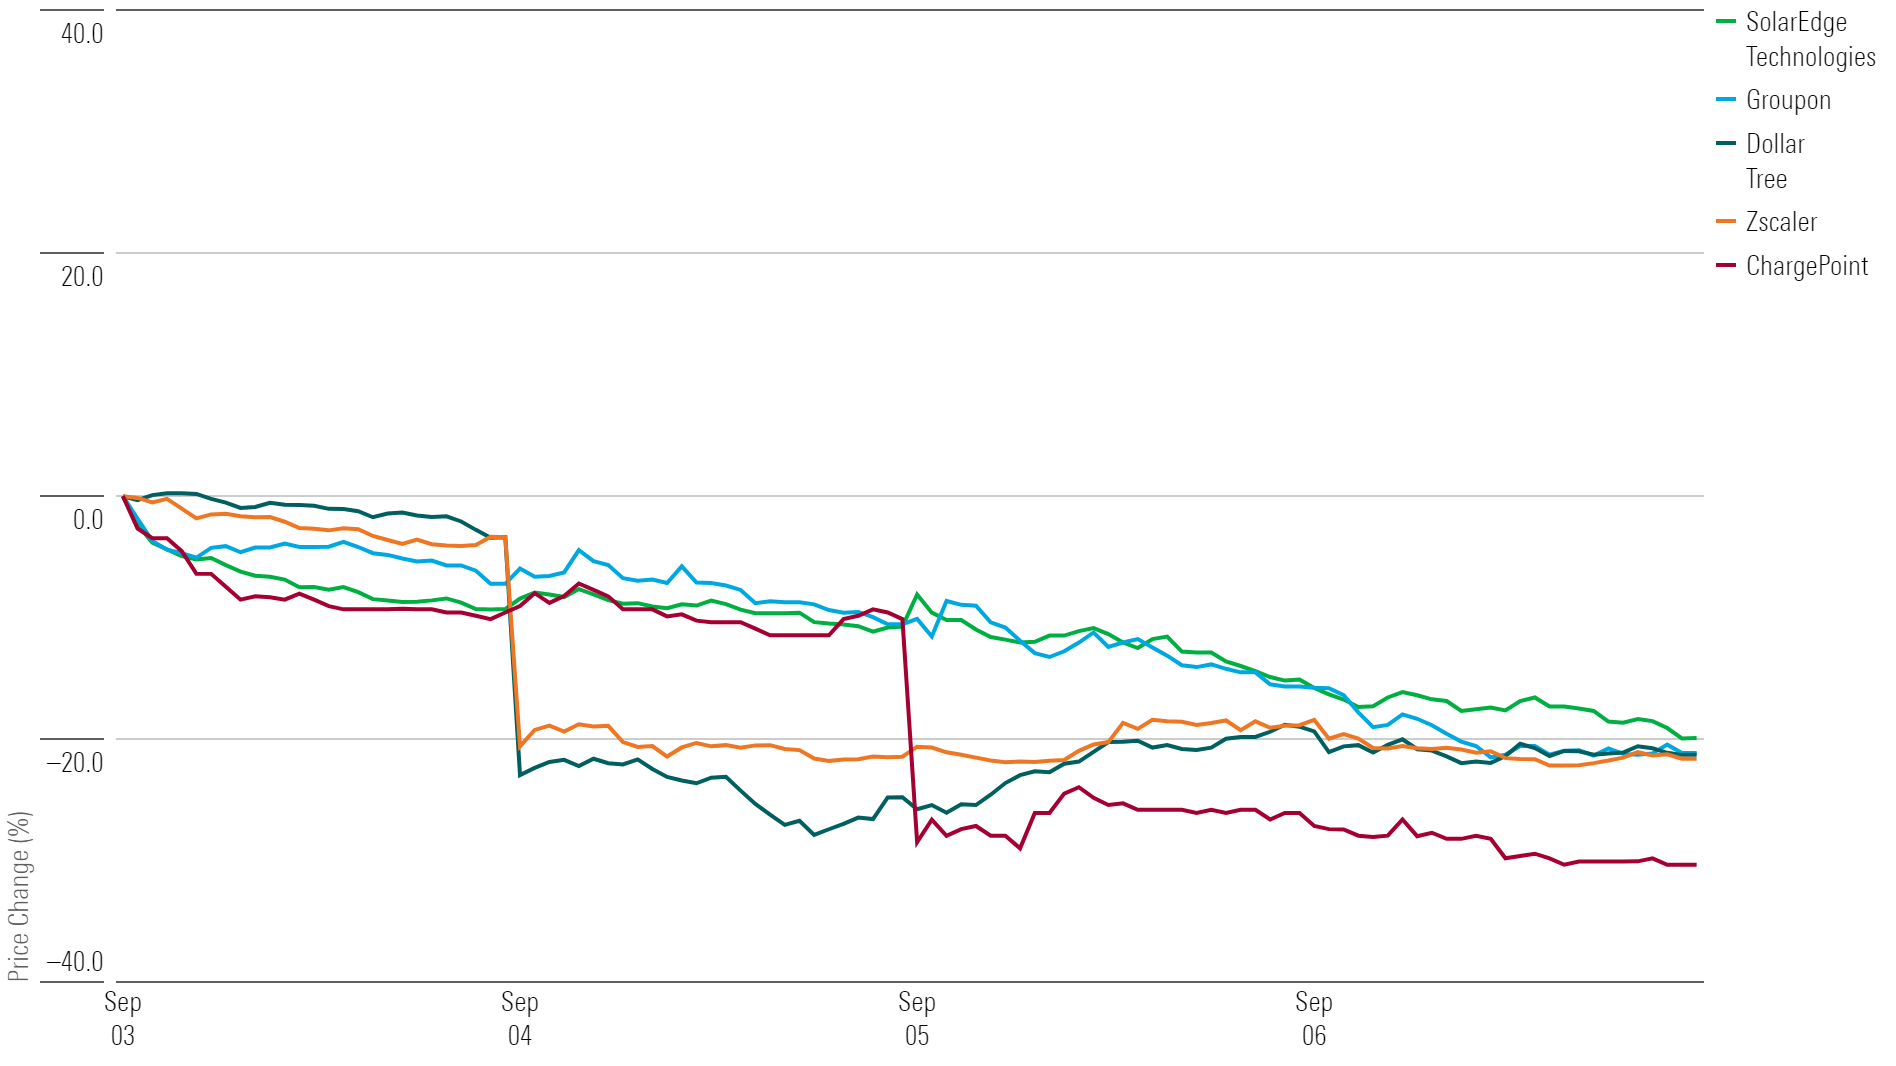
What Stocks Are Down?
ChargePoint Holdings CHPT, Zscaler ZS, Dollar Tree DLTR, Groupon GRPN, SolarEdge Technologies SEDG
Worst-Performing Stock of the Week
The author or authors do not own shares in any securities mentioned in this article. Find out about Morningstar’s editorial policies.
/cloudfront-us-east-1.images.arcpublishing.com/morningstar/VUWQI723Q5E43P5QRTRHGLJ7TI.png)
/cloudfront-us-east-1.images.arcpublishing.com/morningstar/UUSODIGU4REULCOR35PTDS7HW4.jpg)
/cloudfront-us-east-1.images.arcpublishing.com/morningstar/HBAEAVIJHFEBTPMEK2UMVQ3NFQ.png)
:quality(80)/s3.amazonaws.com/arc-authors/morningstar/687c42c2-15b8-4c8d-a9f6-6fadac96dd73.jpg)